গতিশীল পরিসীমা ফিল্টারগুলির সাথে মিলিত উন্নত পরিমাণগত প্রবণতা ক্যাপচারিং কৌশলগুলি

EMA MA RF VOL SMA HA
সৃষ্টির তারিখ: 2024-12-17 14:31:11 অবশেষে সংশোধন করুন: 2024-12-17 14:31:11
অনুলিপি: 4 ক্লিকের সংখ্যা: 420
1
ফোকাস
1617
অনুসারী

গতিশীল পরিসীমা ফিল্টারগুলির সাথে মিলিত উন্নত পরিমাণগত প্রবণতা ক্যাপচারিং কৌশলগুলি

ওভারভিউ

এই কৌশলটি একটি উচ্চমানের পরিমাণগত ট্রেডিং সিস্টেম যা চলমান গড় এবং গতিশীল ব্যাপ্তি ফিল্টারগুলির সাথে মিলিত। এটি মূলত মূল্য পরিবর্তন এবং লেনদেনের পরিমাণের মধ্যে সম্পর্কের বিশ্লেষণ করে বাজারের প্রবণতা সনাক্ত করে এবং ব্যাপ্তি ফিল্টার ব্যবহার করে মিথ্যা সংকেতগুলি ফিল্টার করে, লেনদেনের নির্ভুলতা উন্নত করে। কৌশলটি বাজারের তরলতার সীমানা নির্ধারণের জন্য একটি স্বনির্ধারিত গণনা পদ্ধতি ব্যবহার করে এবং প্রবণতার দিকনির্দেশের জন্য দ্রুত এবং ধীর গতির গড়ের সাথে মিলিত হয়।

কৌশল নীতি

কৌশলটির মূল যুক্তি নিম্নলিখিত কয়েকটি মূল গণনার উপর ভিত্তি করে তৈরি করা হয়েছেঃ

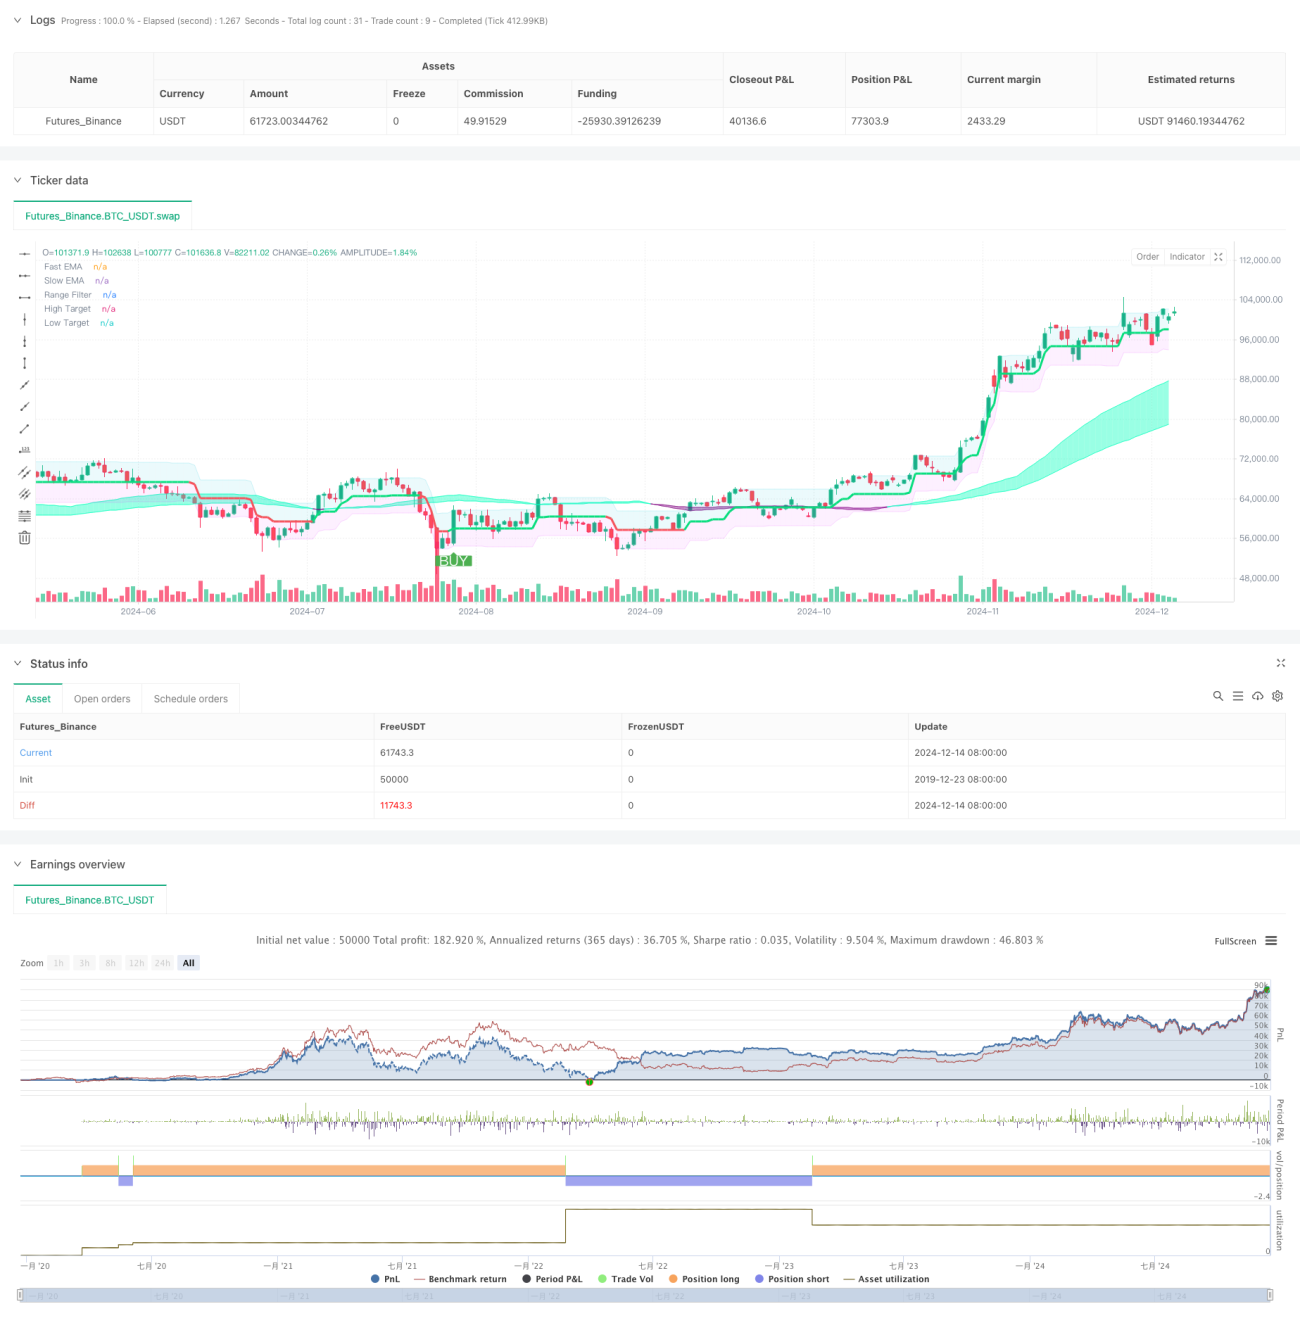
  1. তরলতা বিশ্লেষণ: লেনদেনের পরিমাণ এবং দামের পরিবর্তনের অনুপাত গণনা করে বাজারের তরলতা মূল্যায়ন করুন এবং গতিশীল তরলতার সীমানা সেট করুন।
  2. প্রবণতা নিশ্চিতকরণঃ প্রবণতার দিকনির্দেশনা নিশ্চিত করতে ৫০ ও ১০০ চক্রের ইন্ডেক্সাল মুভিং এভারেজ (ইএমএ) ব্যবহার করা হয়।
  3. পরিসীমা ফিল্টারিংঃ 50 চক্রের নমুনা চক্র এবং 3x পরিসীমা গুণক ব্যবহার করে একটি গতিশীল লেনদেনের অঞ্চল তৈরি করা হয়েছে।
  4. সংকেত উৎপন্নকরণঃ যখন দাম পরিসীমা ফিল্টার অতিক্রম করে এবং ইএমএ সূচক প্রবণতা দেখায়, তখন ট্রেডিং সংকেত উৎপন্ন করা হয়।

কৌশলগত সুবিধা

  1. স্বনির্ধারণযোগ্যতা: কৌশলটি বাজারের অবস্থার উপর নির্ভর করে প্যারামিটারগুলিকে গতিশীলভাবে সামঞ্জস্য করতে পারে এবং বিভিন্ন বাজারের পরিবেশের সাথে খাপ খাইয়ে নিতে পারে।
  2. সিগন্যাল নির্ভরযোগ্যতাঃ একাধিক প্রযুক্তিগত সূচক এবং ফিল্টারগুলির সমন্বয়ে, মিথ্যা সংকেত কার্যকরভাবে হ্রাস করুন।
  3. ঝুঁকি ব্যবস্থাপনা উন্নতঃ স্টপ লস পজিশনের স্বয়ংক্রিয় গণনা সমন্বিত, যা কার্যকরভাবে ঝুঁকি নিয়ন্ত্রণ করতে পারে।
  4. পুনর্নির্মাণ সম্পূর্ণঃ কৌশল অপ্টিমাইজেশান সহজ করার জন্য বিস্তারিত পুনর্নির্মাণ সেটিংস অন্তর্ভুক্ত।

কৌশলগত ঝুঁকি

  1. প্যারামিটার সংবেদনশীলতা: কৌশলটির একাধিক প্যারামিটারগুলিকে সূক্ষ্মভাবে সামঞ্জস্য করতে হয় এবং এটিকে খুব সহজেই অপ্টিমাইজ করা যায়।
  2. স্লাইড পয়েন্ট প্রভাবঃ উচ্চ অস্থিরতার বাজারে, স্লাইড পয়েন্টের ঝুঁকি বেশি হতে পারে।
  3. বাজার অভিযোজনযোগ্যতাঃ প্রায়শই মিথ্যা সংকেত হতে পারে।
  4. তহবিল ব্যবস্থাপনাঃ স্থির তহবিলের বরাদ্দ সব বাজার অবস্থার জন্য উপযুক্ত নাও হতে পারে।

কৌশল অপ্টিমাইজেশনের দিকনির্দেশনা

  1. প্যারামিটার স্বনির্ধারণঃ স্বনির্ধারণ প্যারামিটার সমন্বয় ব্যবস্থা চালু করা যেতে পারে, যাতে প্যারামিটারগুলি বাজার পরিস্থিতি অনুযায়ী স্বয়ংক্রিয়ভাবে সামঞ্জস্য করতে পারে।
  2. মার্কেট স্ট্যাটাস আইডেন্টিফিকেশনঃ মার্কেট স্ট্যাটাস বিচার করার মডিউল যোগ করা হয়েছে, যা বিভিন্ন বাজারের অবস্থার অধীনে বিভিন্ন ট্রেডিং কৌশল ব্যবহার করে।
  3. তহবিল ব্যবস্থাপনা অপ্টিমাইজেশানঃ বাজারের অস্থিরতার উপর ভিত্তি করে ডায়নামিক পজিশন ম্যানেজমেন্ট চালু করা হয়েছে।
  4. সংকেত পরিস্রাবণ উন্নতঃ ভুয়া সংকেত পরিস্রাবণ করার জন্য আরও প্রযুক্তিগত সূচক যুক্ত করা যেতে পারে।

সারসংক্ষেপ

এই কৌশলটি তরলতা বিশ্লেষণ, প্রবণতা ট্র্যাকিং এবং ব্যাপ্তি ফিল্টারগুলির সাথে একত্রিত করে একটি সম্পূর্ণ পরিমাণযুক্ত ট্রেডিং সিস্টেম তৈরি করে। এর সুবিধা হ’ল এটি বাজারের পরিবর্তনের সাথে খাপ খাইয়ে নিতে এবং নির্ভরযোগ্য ট্রেডিং সিগন্যাল সরবরাহ করতে সক্ষম, তবে এটির সাথে প্যারামিটার অপ্টিমাইজেশন এবং ঝুঁকি পরিচালনার দিকেও মনোযোগ দেওয়া দরকার। ক্রমাগত অপ্টিমাইজেশন এবং উন্নতির মাধ্যমে, কৌশলটি বিভিন্ন বাজারের পরিস্থিতিতে স্থিতিশীল পারফরম্যান্স বজায় রাখার প্রত্যাশা করে।

কৌশল সোর্স কোড
/*backtest
start: 2019-12-23 08:00:00
end: 2024-12-15 08:00:00
period: 1d
basePeriod: 1d
exchanges: [{"eid":"Futures_Binance","currency":"BTC_USDT"}]
*/

//@version=6
strategy("Killer Coin V2 + Range Filter Strategy", shorttitle="KC-RF Strategy", overlay=true
         )

// === INPUT BACKTEST RANGE ===
useDate = input(true, title='---------------- Use Date ----------------', group="Backtest Settings")
FromMonth = input.int(7, title="From Month", minval=1, maxval=12, group="Backtest Settings")
FromDay = input.int(25, title="From Day", minval=1, maxval=31, group="Backtest Settings")
FromYear = input.int(2019, title="From Year", minval=2017, group="Backtest Settings")
ToMonth = input.int(1, title="To Month", minval=1, maxval=12, group="Backtest Settings")
ToDay = input.int(1, title="To Day", minval=1, maxval=31, group="Backtest Settings")
ToYear = input.int(9999, title="To Year", minval=2017, group="Backtest Settings")
start = timestamp(FromYear, FromMonth, FromDay, 00, 00)
finish = timestamp(ToYear, ToMonth, ToDay, 23, 59)
window() => time >= start and time <= finish

// === KILLER COIN V2 INPUTS ===
outlierThreshold = input.int(10, "Outlier Threshold Length", group="Killer Coin Settings")
fastMovingAverageLength = input.int(50, "Fast MA length", group="Killer Coin Settings")
slowMovingAverageLength = input.int(100, "Slow MA length", group="Killer Coin Settings")

// === RANGE FILTER INPUTS ===
sources = input(close, "Source", group="Range Filter Settings")
isHA = input(false, "Use HA Candles", group="Range Filter Settings")
per = input.int(50, "Sampling Period", minval=1, group="Range Filter Settings")
mult = input.float(3.0, "Range Multiplier", minval=0.1, group="Range Filter Settings")

// === KILLER COIN V2 CALCULATIONS ===
priceMovementLiquidity = volume / math.abs(close - open)
liquidityBoundary = ta.ema(priceMovementLiquidity, outlierThreshold) + ta.stdev(priceMovementLiquidity, outlierThreshold)
var liquidityValues = array.new_float(5)

if ta.crossover(priceMovementLiquidity, liquidityBoundary)
    array.insert(liquidityValues, 0, close)

fastEMA = ta.ema(array.get(liquidityValues, 0), fastMovingAverageLength)
slowEMA = ta.ema(array.get(liquidityValues, 0), slowMovingAverageLength)

// === RANGE FILTER CALCULATIONS ===
src = isHA ? request.security(ticker.heikinashi(syminfo.tickerid), timeframe.period, sources) : sources

// Smooth Average Range
smoothrng(x, t, m) =>
    wper = (t*2) - 1
    avrng = ta.ema(math.abs(x - x[1]), t)
    smoothrng = ta.ema(avrng, wper)*m
    smoothrng

smrng = smoothrng(src, per, mult)

// Range Filter
rngfilt(x, r) =>
    rngfilt = x
    rngfilt := x > nz(rngfilt[1]) ? ((x - r) < nz(rngfilt[1]) ? nz(rngfilt[1]) : (x - r)) : ((x + r) > nz(rngfilt[1]) ? nz(rngfilt[1]) : (x + r))
    rngfilt

filt = rngfilt(src, smrng)

// Filter Direction
upward = 0.0
upward := filt > filt[1] ? nz(upward[1]) + 1 : filt < filt[1] ? 0 : nz(upward[1])
downward = 0.0
downward := filt < filt[1] ? nz(downward[1]) + 1 : filt > filt[1] ? 0 : nz(downward[1])

// Target Bands
hband = filt + smrng
lband = filt - smrng

// === PLOTTING ===
// Killer Coin V2 Plots
bullColor = color.new(#00ffbb, 50)
bearColor = color.new(#800080, 50)
fastPlot = plot(fastEMA, "Fast EMA", color = fastEMA > slowEMA ? bullColor : bearColor)
slowPlot = plot(slowEMA, "Slow EMA", color = fastEMA > slowEMA ? bullColor : bearColor)
fill(fastPlot, slowPlot, color = fastEMA > slowEMA ? bullColor : bearColor)

// Range Filter Plots
filtcolor = upward > 0 ? color.new(color.lime, 0) : downward > 0 ? color.new(color.red, 0) : color.new(color.orange, 0)
filtplot = plot(filt, "Range Filter", color=filtcolor, linewidth=3)
hbandplot = plot(hband, "High Target", color=color.new(color.aqua, 90))
lbandplot = plot(lband, "Low Target", color=color.new(color.fuchsia, 90))
fill(hbandplot, filtplot, color=color.new(color.aqua, 90))
fill(lbandplot, filtplot, color=color.new(color.fuchsia, 90))

// === STRATEGY CONDITIONS ===
// Range Filter Conditions
longCond = ((src > filt) and (src > src[1]) and (upward > 0)) or ((src > filt) and (src < src[1]) and (upward > 0))
shortCond = ((src < filt) and (src < src[1]) and (downward > 0)) or ((src < filt) and (src > src[1]) and (downward > 0))

CondIni = 0
CondIni := longCond ? 1 : shortCond ? -1 : CondIni[1]
longCondition = longCond and CondIni[1] == -1
shortCondition = shortCond and CondIni[1] == 1

// Combined Conditions
finalLongSignal = longCondition and fastEMA > slowEMA and window()
finalShortSignal = shortCondition and fastEMA < slowEMA and window()

// === PLOTTING SIGNALS ===
plotshape(finalLongSignal, "Buy Signal", text="BUY", textcolor=color.white, 
         style=shape.labelup, size=size.normal, location=location.belowbar, 
         color=color.new(color.green, 0))
         
plotshape(finalShortSignal, "Sell Signal", text="SELL", textcolor=color.white, 
         style=shape.labeldown, size=size.normal, location=location.abovebar, 
         color=color.new(color.red, 0))

// === STRATEGY ENTRIES ===
if finalLongSignal
    strategy.entry("Long", strategy.long, stop=hband)
    
if finalShortSignal
    strategy.entry("Short", strategy.short, stop=lband)

// === ALERTS ===
alertcondition(finalLongSignal, "Strong Buy Signal", "🚨 Buy - Both Indicators Aligned!")
alertcondition(finalShortSignal, "Strong Sell Signal", "🚨 Sell - Both Indicators Aligned!")