
ওভারভিউ
এই কৌশলটি একাধিক প্রযুক্তিগত সূচক সমন্বয় উপর ভিত্তি করে একটি প্রবণতা ট্র্যাকিং অপশন ট্রেডিং কৌশল। প্রধানত ইএমএ ক্রসকে কেন্দ্রীয় সংকেত হিসাবে ব্যবহার করে, এসএমএ, ভিডাব্লুএপি প্রবণতা দিকনির্দেশের সাথে মিলিত হয়, এবং এমএসিডি এবং আরএসআইকে সহায়ক সূচক হিসাবে ব্যবহার করে সংকেত ফিল্টারিং করা হয়। কৌশলটি স্থির স্টপ পয়েন্ট পয়েন্ট ম্যানেজমেন্ট ঝুঁকি গ্রহণ করে, কঠোর প্রবেশের শর্ত এবং অবস্থান পরিচালনার মাধ্যমে ব্যবসায়ের সাফল্যের হার বাড়ায়।
কৌশল নীতি
কৌশলটি 8 চক্র এবং 21 চক্রের ইএমএর ক্রসগুলিকে প্রধান ট্রেডিং সিগন্যাল হিসাবে ব্যবহার করে, যখন স্বল্পমেয়াদী ইএমএ দীর্ঘমেয়াদী ইএমএ অতিক্রম করে এবং নিম্নলিখিত শর্তগুলি পূরণ করে তখন একাধিক সিগন্যাল ট্রিগার করেঃ দাম 100 এবং 200 চক্রের এসএমএর উপরে থাকে, এমএসিডি লাইনটি সিগন্যাল লাইনের উপরে থাকে, আরএসআই 50 এর চেয়ে বড়। খালি সিগন্যালের ট্রিগার শর্তগুলি বিপরীত। কৌশলটি ভিডাব্লুএপিকে মূল্যের ওজনের রেফারেন্স হিসাবে প্রবর্তন করে, যা বর্তমান দামের আপেক্ষিক অবস্থান নির্ধারণে সহায়তা করে। প্রতিটি ব্যবসায়ের জন্য একটি নির্দিষ্ট 1 চুক্তিটি ট্রেডিং ভলিউম হিসাবে ব্যবহৃত হয় এবং 5% স্টপিং পয়েন্ট সেট করা হয়। কৌশলটি ওপেনপোজিশন চিহ্নের মাধ্যমে পজিশনের অবস্থা ট্র্যাক করে এবং একই সময়ে কেবলমাত্র একটি অবস্থান রাখার বিষয়টি নিশ্চিত করে।
কৌশলগত সুবিধা
- একাধিক সূচক সমন্বয়, বিভিন্ন সময়কাল এবং প্রকারের সূচক ক্রস যাচাইকরণের মাধ্যমে সংকেতের নির্ভরযোগ্যতা বাড়ায়
- প্রবণতা ট্র্যাকিং এবং গতিশীলতা সূচকগুলির সমন্বয়ে প্রবণতা ক্যাপচার এবং স্বল্পমেয়াদী গতিশীলতার দিকে নজর দেওয়া
- ফিক্সড স্টপ-অফ-পয়েন্ট বিটগুলি লভ্যাংশ রক্ষা করতে এবং অত্যধিক লোভ থেকে রক্ষা করতে সহায়তা করে
- পজিশন পরিচালনার ক্ষেত্রে কঠোরতা, পুনরাবৃত্তি এড়ানো এবং ঝুঁকি হ্রাস করা
- ইএমএ, এসএমএ, ভিডাব্লুএপি ট্র্যাফিক এবং সংকেত চিহ্নিতকরণ সহ স্পষ্ট ভিজ্যুয়ালাইজেশন
কৌশলগত ঝুঁকি
- অস্থির বাজারে ঘন ঘন মিথ্যা সংকেত দেখা দিতে পারে।
- স্থির স্টপ-অফ-পয়েন্ট হারানো আরও বেশি লাভের সুযোগ সৃষ্টি করতে পারে
- কোনও স্টপ লস সেটআপ নেই, চরম পরিস্থিতিতে বড় ক্ষতি হতে পারে
- একাধিক সূচক ব্যবহারের ফলে সিগন্যাল বিলম্ব হতে পারে
- স্লাইড পয়েন্টের ঝুঁকি কম তরল বিকল্প চুক্তিতে হতে পারে
কৌশল অপ্টিমাইজেশনের দিকনির্দেশনা
- স্বনির্ধারিত স্টপ-অফ-লস ব্যবস্থা চালু করা, বাজারের অস্থিরতার গতিশীলতার সাথে সামঞ্জস্য করা
- অ্যাকাউন্টের আকার এবং বাজারের অবস্থার উপর ভিত্তি করে অবস্থানগুলিকে গতিশীলভাবে সামঞ্জস্য করার জন্য ভলিউম ম্যানেজমেন্ট মডিউল যুক্ত করা
- বাজারের ওঠানামা ফিল্টার যুক্ত করুন, উচ্চ ওঠানামার পরিবেশে কৌশলগত প্যারামিটারগুলি সামঞ্জস্য করুন
- সূচক প্যারামিটার অপ্টিমাইজ করার জন্য, একটি নির্দিষ্ট সময়ের পরিবর্তে একটি স্বনির্ধারিত সময়ের ব্যবহার বিবেচনা করা যেতে পারে
- সময় ফিল্টার যুক্ত করুন, বাজারের খোলা এবং বন্ধের মতো উচ্চতর ওঠানামার সময় ট্রেডিং এড়িয়ে চলুন
সারসংক্ষেপ
এটি একটি কাঠামোগত, যুক্তিসঙ্গতভাবে সুস্পষ্ট, একাধিক সূচক ট্রেডিং কৌশল। কৌশলটি একাধিক প্রযুক্তিগত সূচকগুলির সমন্বয়মূলক সমন্বয় দ্বারা ট্রেডিং সিগন্যালের নির্ভরযোগ্যতা বাড়ায় এবং নির্দিষ্ট স্টপ পয়েন্টের অবস্থান ব্যবহার করে ঝুঁকি পরিচালনা করে। কৌশলটির কিছু অন্তর্নিহিত ঝুঁকি থাকা সত্ত্বেও, প্রস্তাবিত অপ্টিমাইজেশনের দিকনির্দেশগুলি কৌশলটির স্থায়িত্ব এবং লাভজনকতা আরও বাড়িয়ে তুলতে পারে। কৌশলটির ভিজ্যুয়াল ডিজাইনটি ব্যবসায়ীদের স্বজ্ঞাতভাবে ট্রেডিং সংকেত বুঝতে এবং সম্পাদন করতে সহায়তা করে।
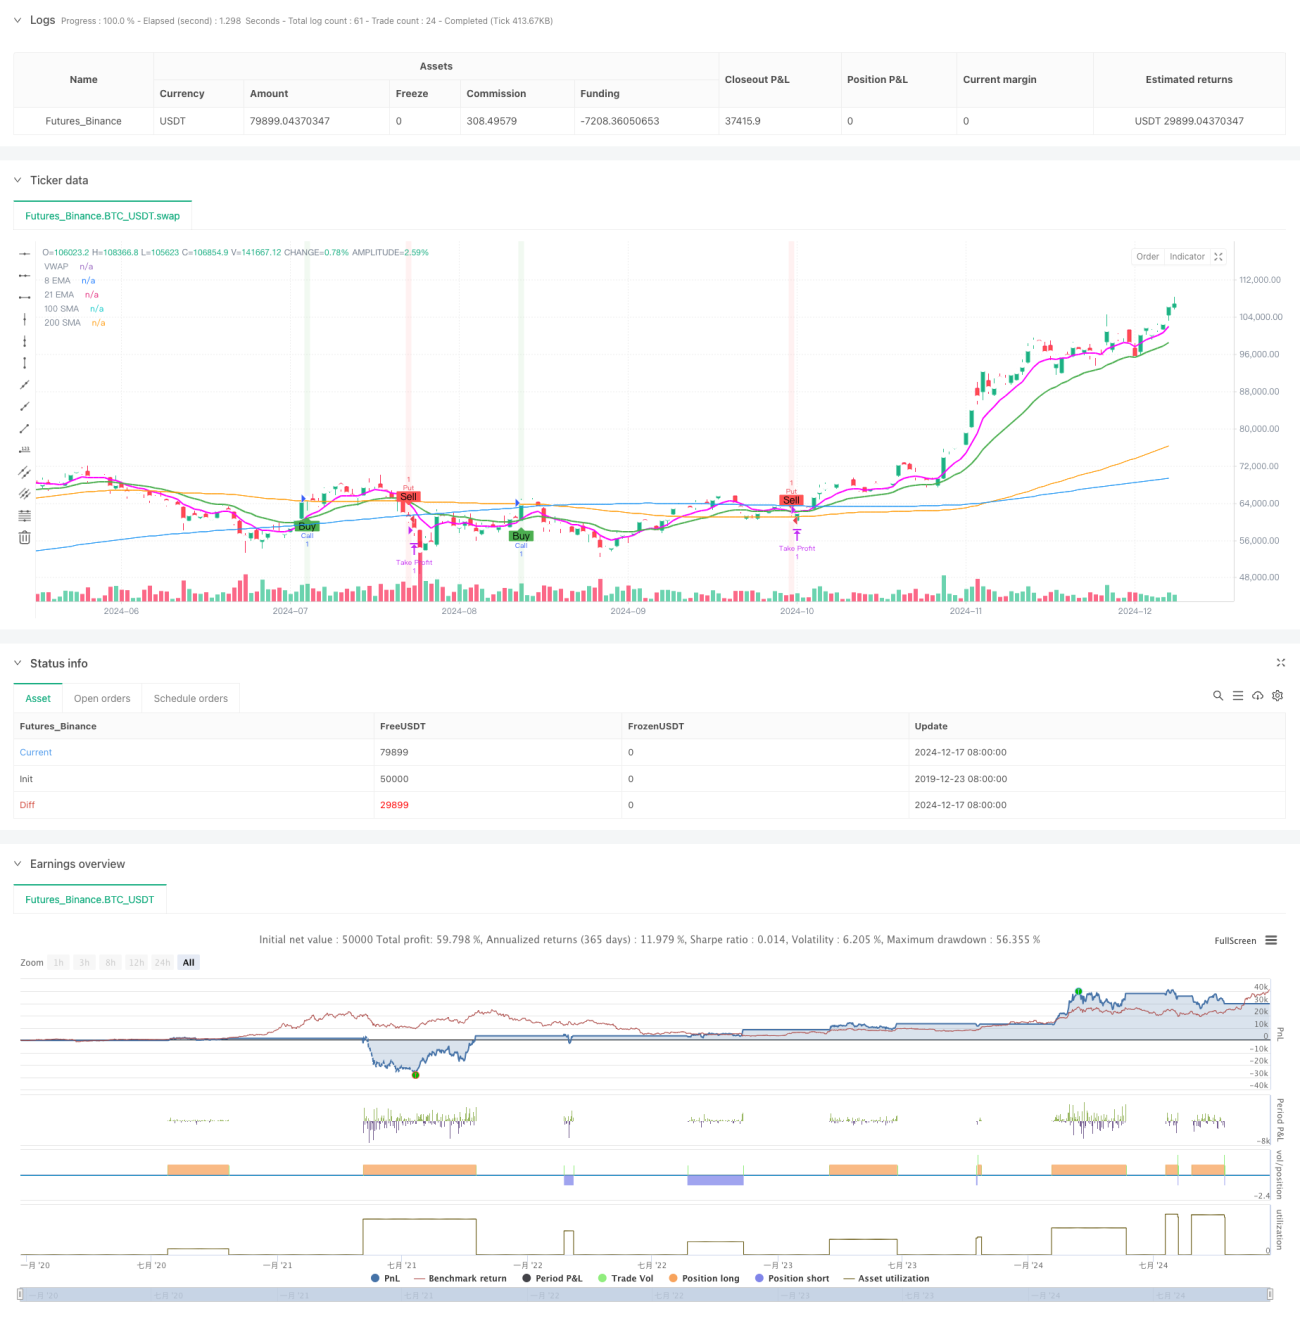
/*backtest
start: 2019-12-23 08:00:00
end: 2024-12-18 08:00:00
period: 1d
basePeriod: 1d
exchanges: [{"eid":"Futures_Binance","currency":"BTC_USDT"}]
*/

//@version=5
strategy("OptionsMillionaire Strategy with Take Profit Only", overlay=true, default_qty_type=strategy.fixed, default_qty_value=1)

// Define custom magenta color- 1