
ওভারভিউ
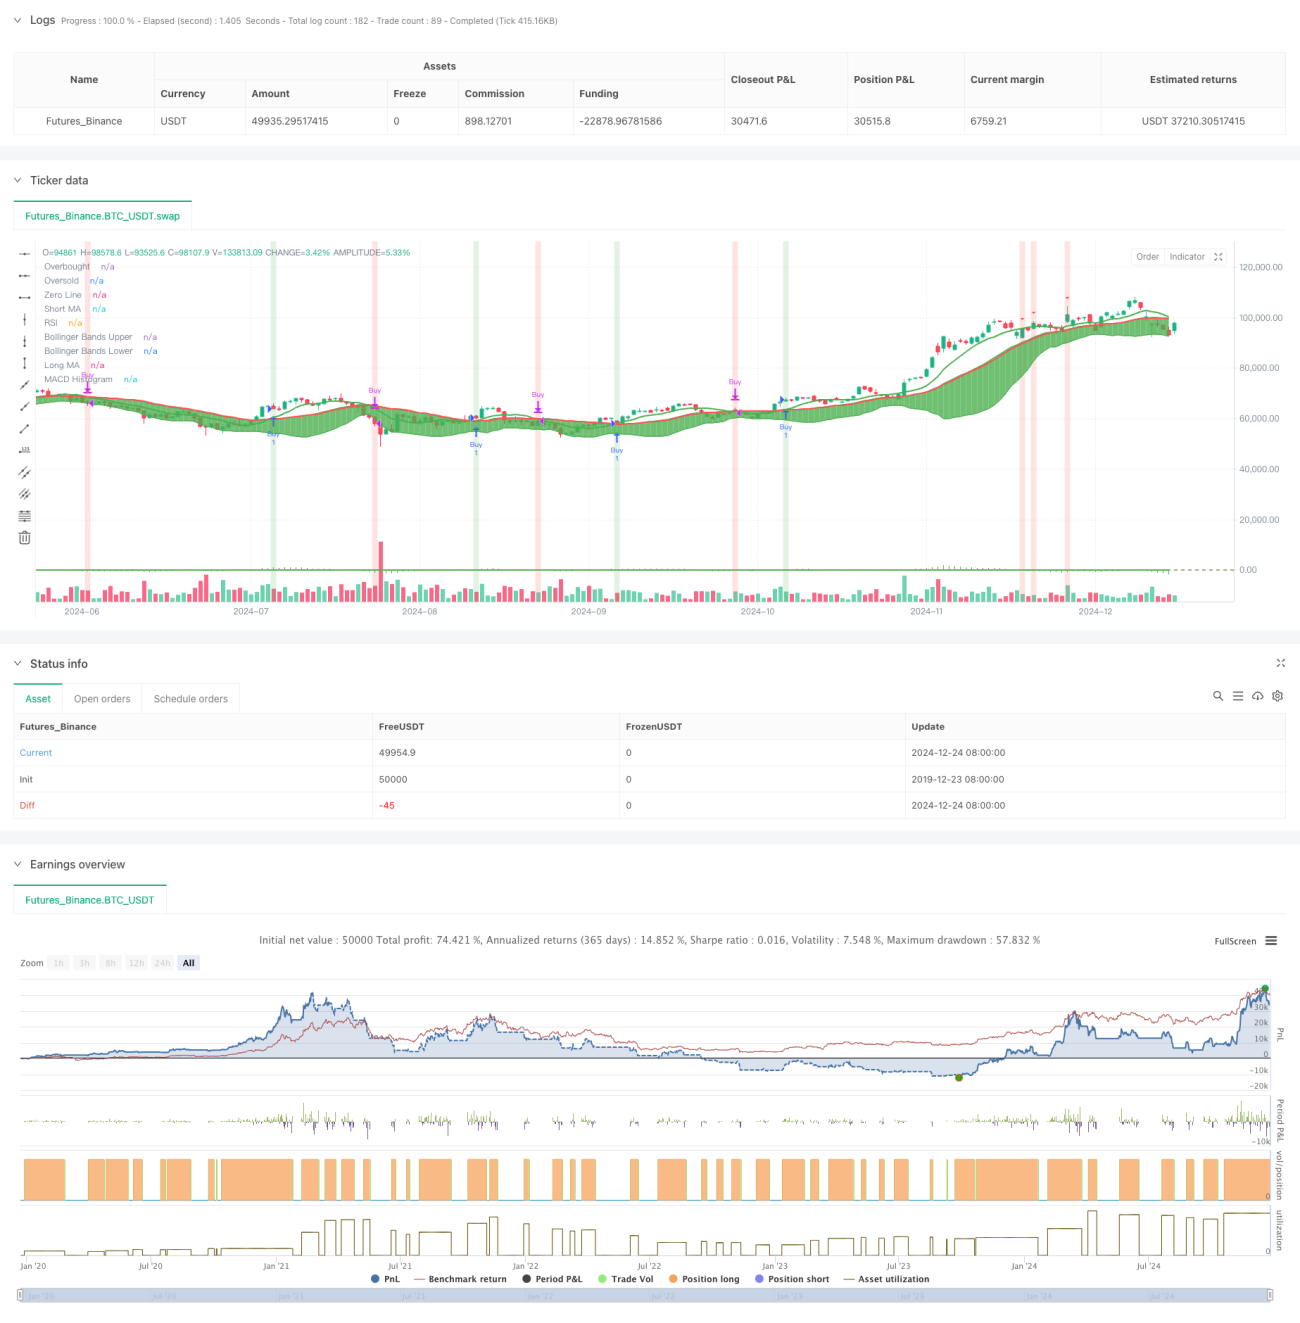
এই কৌশলটি একটি ব্যাপক ট্রেডিং সিস্টেম যা মুভিং এভারেজ (MA), আপেক্ষিক শক্তি সূচক (RSI), মুভিং এভারেজ কনভারজেন্স ডাইভারজেন্স (MACD), এবং বলিঞ্জার ব্যান্ডস (BB) সহ বেশ কয়েকটি ক্লাসিক প্রযুক্তিগত সূচককে একত্রিত করে। এই সূচকগুলির সমন্বয়ের মাধ্যমে, সিস্টেমটি বাজারে আরও সঠিক ক্রয়-বিক্রয়ের সংকেত খোঁজে, যার ফলে লেনদেনের সাফল্যের হার উন্নত হয়।
কৌশল নীতি
কৌশলটি একটি বহু-স্তর সংকেত যাচাইকরণ প্রক্রিয়া গ্রহণ করে, যা প্রধানত নিম্নলিখিত দিকগুলি অন্তর্ভুক্ত করে:
- অন্তর্নিহিত প্রবণতার দিকটি স্বল্প-মেয়াদী (9-দিন) এবং দীর্ঘ-মেয়াদী (21-দিন) চলমান গড়গুলির ছেদ দ্বারা নির্ধারিত হয়।
- অতিরিক্ত কেনা এবং বেশি বিক্রি হওয়া এলাকা চিহ্নিত করতে RSI (14-দিন) ব্যবহার করুন, মূল স্তর হিসেবে 70 এবং 30 সেট করুন
- ট্রেন্ড শক্তি এবং সম্ভাব্য টার্নিং পয়েন্ট নিশ্চিত করতে MACD(12,26,9) ব্যবহার করুন
- দামের ওঠানামা এবং সম্ভাব্য বিপরীত পয়েন্টের পরিসর নির্ধারণ করতে বলিঞ্জার ব্যান্ড (20-দিন, 2 বার স্ট্যান্ডার্ড বিচ্যুতি) ব্যবহার করুন
সিস্টেম নিম্নলিখিত অবস্থার অধীনে ট্রেডিং সংকেত তৈরি করে:
- প্রধান ক্রয় সংকেত: স্বল্প-মেয়াদী MA দীর্ঘমেয়াদী MA এর উপরে অতিক্রম করে
- প্রধান বিক্রয় সংকেত: স্বল্প-মেয়াদী MA দীর্ঘ-মেয়াদী MA এর নিচে অতিক্রম করে
- সেকেন্ডারি বাই সিগন্যাল: 30 এর নিচে RSI এবং MACD হিস্টোগ্রাম ইতিবাচক এবং দাম নিম্ন বলিংগার ব্যান্ডকে আঘাত করে
- সেকেন্ডারি সেল সিগন্যাল: RSI 70 এর উপরে এবং MACD হিস্টোগ্রাম নেতিবাচক এবং দাম উপরের বলিঙ্গার ব্যান্ডগুলিকে স্পর্শ করে
কৌশলগত সুবিধা
- বহুমাত্রিক বিশ্লেষণ: একাধিক প্রযুক্তিগত সূচককে একীভূত করে আরও ব্যাপক বাজার বিশ্লেষণের দৃষ্টিভঙ্গি প্রদান করুন
- সংকেত নিশ্চিতকরণ প্রক্রিয়া: প্রধান এবং সহায়ক সংকেতের সংমিশ্রণ মিথ্যা সংকেতের প্রভাব কমাতে পারে
- নিখুঁত ঝুঁকি নিয়ন্ত্রণ: এন্ট্রি পয়েন্টের ঝুঁকি নিয়ন্ত্রণ করতে বলিঞ্জার ব্যান্ড এবং RSI এর সমন্বয় ব্যবহার করুন
- প্রবণতা অনুসরণ করার ক্ষমতা: MA এবং MACD-এর সহযোগিতার মাধ্যমে, এটি শুধুমাত্র মূল প্রবণতাকে উপলব্ধি করতে পারে না, প্রবণতার টার্নিং পয়েন্টকেও চিহ্নিত করতে পারে।
- শক্তিশালী ভিজ্যুয়ালাইজেশন প্রভাব: সিস্টেমটি পটভূমির রঙ টিপস এবং আকৃতি চিহ্নিতকারী সহ একটি পরিষ্কার গ্রাফিকাল ইন্টারফেস প্রদান করে
কৌশলগত ঝুঁকি
- সিগন্যাল হিস্টেরেসিস: চলমান গড়ের নিজেই হিস্টেরেসিস থাকে, যা আদর্শ এন্ট্রি পয়েন্টের চেয়ে কম হতে পারে
- অস্থির বাজার ঝুঁকি: একটি অস্থির বাজারে ঘন ঘন মিথ্যা সংকেত ঘটতে পারে।
- সূচক দ্বন্দ্ব: একাধিক সূচক নির্দিষ্ট সময়ে পরস্পরবিরোধী সংকেত তৈরি করতে পারে
- পরামিতি সংবেদনশীলতা: কৌশল প্রভাব প্যারামিটার সেটিংসের প্রতি আরও সংবেদনশীল এবং পর্যাপ্ত প্যারামিটার অপ্টিমাইজেশান প্রয়োজন।
কৌশল অপ্টিমাইজেশনের দিকনির্দেশনা
- গতিশীল পরামিতি সমন্বয়: প্রতিটি সূচকের পরামিতি বাজারের অস্থিরতা অনুযায়ী স্বয়ংক্রিয়ভাবে সামঞ্জস্য করা যেতে পারে
- বাজার পরিবেশের শ্রেণীবিভাগ: বিভিন্ন বাজার পরিবেশের জন্য স্বীকৃতি ব্যবস্থা যোগ করুন এবং বিভিন্ন বাজার পরিস্থিতিতে বিভিন্ন সংকেত সমন্বয় ব্যবহার করুন।
- উন্নত স্টপ লস মেকানিজম: আরও নমনীয় স্টপ লস সমাধান যোগ করুন, যেমন ট্রেলিং স্টপ লস বা এটিআর-ভিত্তিক স্টপ লস
- অবস্থান ব্যবস্থাপনা অপ্টিমাইজেশান: গতিশীলভাবে সংকেত শক্তি এবং বাজারের অস্থিরতার উপর ভিত্তি করে অবস্থানের আকার সামঞ্জস্য করুন
- টাইমফ্রেম সিনার্জি: সিগন্যালের নির্ভরযোগ্যতা উন্নত করতে একাধিক টাইমফ্রেম বিশ্লেষণ যোগ করার কথা বিবেচনা করুন
সারসংক্ষেপ
এটি একটি সু-পরিকল্পিত বহু-মাত্রিক ট্রেডিং কৌশল ব্যবস্থা যা একাধিক প্রযুক্তিগত সূচকের সমন্বয়ের মাধ্যমে ট্রেডিং সংকেত প্রদান করে। কৌশলটির প্রধান সুবিধাটি এর ব্যাপক বিশ্লেষণ কাঠামো এবং কঠোর সংকেত নিশ্চিতকরণ প্রক্রিয়ার মধ্যে রয়েছে, তবে এটি প্যারামিটার অপ্টিমাইজেশান এবং বাজারের পরিবেশ অভিযোজনযোগ্যতার দিকেও মনোযোগ দিতে হবে। প্রস্তাবিত অপ্টিমাইজেশান দিকনির্দেশের মাধ্যমে, এই কৌশলটিতে এখনও উন্নতির জন্য একটি বড় জায়গা রয়েছে।
- 1