
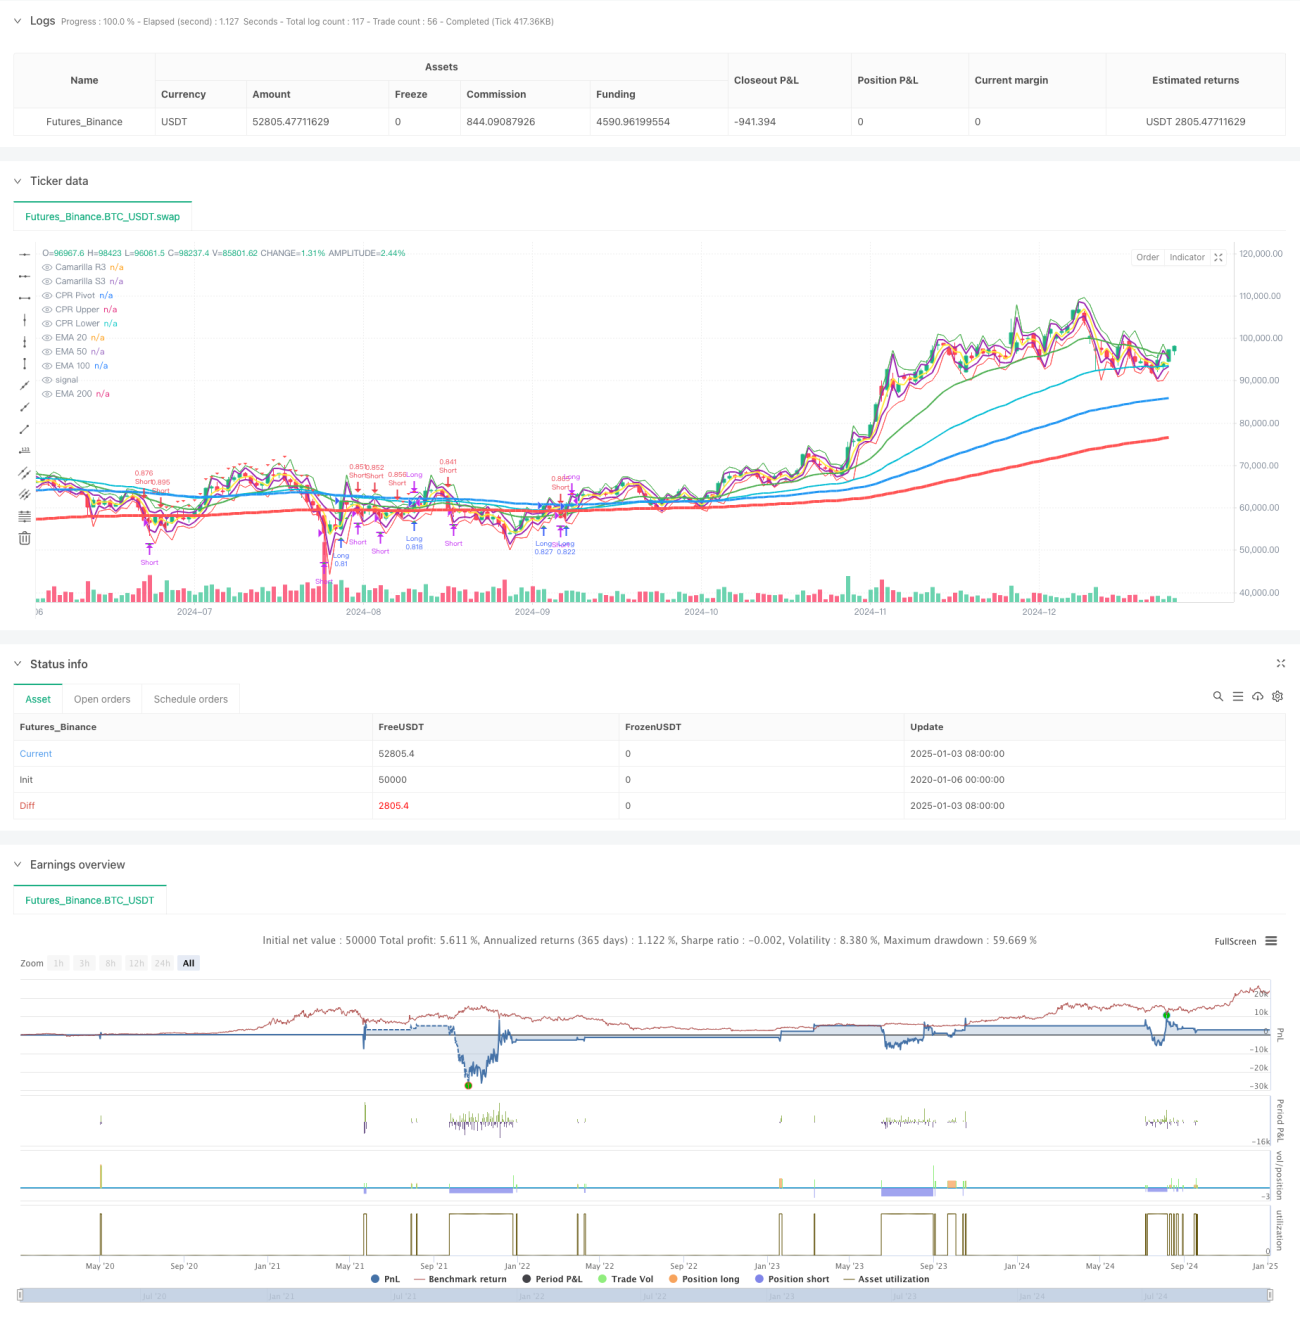
এই কৌশলটি হল একটি ট্রেন্ড অনুসরণকারী ট্রেডিং সিস্টেম যা একাধিক এক্সপোনেনশিয়াল মুভিং এভারেজ (EMA), ক্যামারিলা সাপোর্ট এবং রেজিস্ট্যান্স লেভেল এবং সেন্ট্রাল পিভট রেঞ্জ (CPR) একত্রিত করে। এই কৌশলটি একাধিক চলমান গড় এবং গুরুত্বপূর্ণ মূল্য সীমার সাথে সম্পর্কিত মূল্য বিশ্লেষণ করে বাজারের প্রবণতা এবং সম্ভাব্য ট্রেডিং সুযোগ চিহ্নিত করে। সিস্টেমটি কঠোর তহবিল ব্যবস্থাপনা এবং ঝুঁকি নিয়ন্ত্রণের ব্যবস্থা গ্রহণ করে, যার মধ্যে শতাংশের অবস্থানের আকার এবং বৈচিত্রপূর্ণ প্রস্থান প্রক্রিয়া রয়েছে।
কৌশলটি মূলত নিম্নলিখিত মূল উপাদানগুলির উপর ভিত্তি করে:
এই কৌশলটি একাধিক ক্লাসিক প্রযুক্তিগত বিশ্লেষণ সরঞ্জামকে একীভূত করে একটি সম্পূর্ণ ট্রেডিং সিস্টেম তৈরি করে। সিস্টেমের সুবিধা বহুমাত্রিক বাজার বিশ্লেষণ এবং কঠোর ঝুঁকি ব্যবস্থাপনার মধ্যে রয়েছে, তবে এটিকে বিভিন্ন বাজারের পরিবেশে এর অভিযোজনযোগ্যতার দিকেও মনোযোগ দিতে হবে। ক্রমাগত অপ্টিমাইজেশান এবং উন্নতির মাধ্যমে, কৌশলটি স্থিতিশীলতা বজায় রেখে লাভজনকতা বৃদ্ধি করবে বলে আশা করা হচ্ছে।
/*backtest
start: 2020-01-06 00:00:00
end: 2025-01-04 08:00:00
period: 1d
basePeriod: 1d
exchanges: [{"eid":"Futures_Binance","currency":"BTC_USDT"}]
*/
//@version=5
strategy("Pradeep Crude oil Entry and Exit", overlay=true)
// Input settings for EMAs
ema20_period = input.int(20, title="EMA 20 Period")
ema50_period = input.int(50, title="EMA 50 Period")
ema100_period = input.int(100, title="EMA 100 Period")
ema200_period = input.int(200, title="EMA 200 Period")
// Fixed line width settings for EMAs
ema20_width = 2 // EMA 20 Line Width
ema50_width = 2 // EMA 50 Line Width
ema100_width = 3 // EMA 100 Line Width
ema200_width = 4 // EMA 200 Line Width
// Backtesting inputs
initial_capital = input.float(50000, title="Initial Capital", minval=100)
position_size_percent = input.float(100, title="Position Size (% of Capital)", minval=0.1, maxval=100)
exit_mode = input.string("Price Movement", title="Exit Mode", options=["Price Movement", "Percentage Movement"])
exit_points = input.int(20, title="Exit After X Points", minval=1)
exit_percentage = input.float(1.0, title="Exit After X% Movement", minval=0.1, step=0.1)
// Calculate EMAs
ema20 = ta.ema(close, ema20_period)
ema50 = ta.ema(close, ema50_period)
ema100 = ta.ema(close, ema100_period)
ema200 = ta.ema(close, ema200_period)
// Signal conditions
long_entry_condition = close > ema200 and close > ema20 and close[1] <= ema200
long_exit_condition = (exit_mode == "Price Movement" and close - strategy.position_avg_price >= exit_points * syminfo.mintick) or
(exit_mode == "Percentage Movement" and (close - strategy.position_avg_price) / strategy.position_avg_price * 100 >= exit_percentage)
short_entry_condition = close < ema200 and close < ema20 and close[1] >= ema200
short_exit_condition = (exit_mode == "Price Movement" and strategy.position_avg_price - close >= exit_points * syminfo.mintick) or
(exit_mode == "Percentage Movement" and (strategy.position_avg_price - close) / strategy.position_avg_price * 100 >= exit_percentage)
// Plot EMAs with specified line widths
plot(ema20, color=color.green, title="EMA 20", linewidth=ema20_width)
plot(ema50, color=color.aqua, title="EMA 50", linewidth=ema50_width)
plot(ema100, color=color.blue, title="EMA 100", linewidth=ema100_width)
plot(ema200, color=color.red, title="EMA 200", linewidth=ema200_width)
// Camarilla Pivot Calculation
prev_high = request.security(syminfo.tickerid, "D", high[1])
prev_low = request.security(syminfo.tickerid, "D", low[1])
prev_close = request.security(syminfo.tickerid, "D", close[1])
R3 = prev_close + (prev_high - prev_low) * 1.1 / 2
S3 = prev_close - (prev_high - prev_low) * 1.1 / 2
// Central Pivot Range (CPR) Calculation
pivot = (prev_high + prev_low + prev_close) / 3
upper_cpr = pivot + (prev_high - prev_low)
lower_cpr = pivot - (prev_high - prev_low)
// Plot Camarilla R3, S3 and CPR levels
plot(R3, color=color.purple, title="Camarilla R3", linewidth=2)
plot(S3, color=color.purple, title="Camarilla S3", linewidth=2)
plot(pivot, color=color.yellow, title="CPR Pivot", linewidth=2)
plot(upper_cpr, color=color.green, title="CPR Upper", linewidth=1)
plot(lower_cpr, color=color.red, title="CPR Lower", linewidth=1)
// Backtesting: Capital and position size
capital = initial_capital
risk_per_trade = (position_size_percent / 100) * capital
// Long positions
if long_entry_condition
strategy.entry("Long", strategy.long, qty=risk_per_trade / close)
// Display entry price label
label.new(bar_index, close, text="Entry: " + str.tostring(close), color=color.green, style=label.style_label_up, yloc=yloc.belowbar)
if long_exit_condition
strategy.close("Long")
// Display exit price label
label.new(bar_index, close, text="Exit: " + str.tostring(close), color=color.red, style=label.style_label_down, yloc=yloc.abovebar)
// Short positions
if short_entry_condition
strategy.entry("Short", strategy.short, qty=risk_per_trade / close)
// Display entry price label
label.new(bar_index, close, text="Entry: " + str.tostring(close), color=color.red, style=label.style_label_down, yloc=yloc.abovebar)
if short_exit_condition
strategy.close("Short")
// Display exit price label
label.new(bar_index, close, text="Exit: " + str.tostring(close), color=color.green, style=label.style_label_up, yloc=yloc.belowbar)
// Plot signals
plotshape(long_entry_condition, style=shape.triangleup, location=location.belowbar, color=color.new(color.green, 0), size=size.small, title="Long Entry")
plotshape(long_exit_condition, style=shape.triangledown, location=location.abovebar, color=color.new(color.red, 0), size=size.small, title="Long Exit")
plotshape(short_entry_condition, style=shape.triangledown, location=location.abovebar, color=color.new(color.red, 0), size=size.small, title="Short Entry")
plotshape(short_exit_condition, style=shape.triangleup, location=location.belowbar, color=color.new(color.green, 0), size=size.small, title="Short Exit")