
ওভারভিউ
এই কৌশলটি ট্রেডিং সিস্টেম অনুসরণকারী একটি প্রবণতা যা গতিশীল ঝুঁকি ব্যবস্থাপনার সাথে চলমান গড় ক্রসওভার সংকেতকে একত্রিত করে। এটি বাজারের প্রবণতা সনাক্ত করতে দ্রুত এবং ধীর গতির সূচকীয় চলমান গড় (EMA) ব্যবহার করে, এন্ট্রি টাইমিং অপ্টিমাইজ করতে গড় সত্য পরিসীমা (ATR) নির্দেশকের সাথে মিলিত হয়। একই সময়ে, কৌশলটি শতাংশ স্টপ লস, টার্গেট লাভ এবং ট্রেলিং স্টপ লসের ট্রিপল সুরক্ষা পদ্ধতিকে একীভূত করে।
কৌশল নীতি
কৌশলটির মূল যুক্তি নিম্নলিখিত মূল উপাদানগুলির উপর ভিত্তি করে:
- প্রবণতা দিক নির্ধারণ করতে 5-পিরিয়ড এবং 20-পিরিয়ড EMA ক্রসওভার ব্যবহার করুন
- ATR মাল্টিপল ফিল্টারিংয়ের মাধ্যমে ট্রেডিং সিগন্যালের নির্ভরযোগ্যতা বাড়ান
- যখন একটি EMA ক্রসওভার ঘটে এবং মূল্য ATR চ্যানেলের বাইরে চলে যায় তখন ট্রেডিং সংকেত ট্রিগার হয়
- একটি পজিশন খোলার সাথে সাথে, 1% এর একটি নির্দিষ্ট স্টপ লস এবং 5% লাভের লক্ষ্য নির্ধারণ করুন
- লাভ রক্ষা করতে ATR-ভিত্তিক ট্রেলিং স্টপ ব্যবহার করুন
- দীর্ঘ এবং সংক্ষিপ্ত দ্বি-মুখী ট্রেডিং, বাজারের সুযোগগুলি সম্পূর্ণরূপে দখল করুন
কৌশলগত সুবিধা
- ট্রেডিং নির্ভুলতা বাড়ানোর জন্য সিগন্যাল সিস্টেম প্রবণতা এবং অস্থিরতা সূচককে একত্রিত করে
- গতিশীল ATR চ্যানেল বিভিন্ন বাজারের পরিবেশের ওঠানামার বৈশিষ্ট্যের সাথে খাপ খাইয়ে নিতে পারে
- ট্রিপল ঝুঁকি নিয়ন্ত্রণ ব্যবস্থা লেনদেনের জন্য সর্বাত্মক সুরক্ষা প্রদান করে
- পরামিতিগুলি অত্যন্ত সামঞ্জস্যযোগ্য এবং বিভিন্ন বাজারের বৈশিষ্ট্য অনুসারে অপ্টিমাইজ করা যেতে পারে।
- সিস্টেমে উচ্চ মাত্রার অটোমেশন রয়েছে, যা মানুষের হস্তক্ষেপের মানসিক প্রভাবকে হ্রাস করে।
কৌশলগত ঝুঁকি
- EMA ক্রসওভার ল্যাগ তৈরি করতে পারে, এবং একটি হিংস্রভাবে অস্থির বাজারে সেরা এন্ট্রি পয়েন্ট মিস হতে পারে।
- উচ্চ অস্থিরতার সময় স্থির শতাংশ স্টপ যথেষ্ট নমনীয় নাও হতে পারে
- ঘন ঘন লেনদেনের ফলে উচ্চ হ্যান্ডলিং ফি খরচ হতে পারে
- সীমাবদ্ধ বাজারে ঘন ঘন মিথ্যা সংকেত ঘটতে পারে
- ট্রেলিং স্টপগুলি দ্রুত রিট্রেসমেন্টে তাড়াতাড়ি প্রস্থান করতে পারে
কৌশল অপ্টিমাইজেশনের দিকনির্দেশনা
- প্রবণতা বৈধতা যাচাই করতে ভলিউম সূচক প্রবর্তন
- একটি বাজার পরিবেশ সনাক্তকরণ প্রক্রিয়া যোগ করুন এবং বিভিন্ন বাজারের অবস্থার অধীনে বিভিন্ন পরামিতি ব্যবহার করুন।
- ATR গুণগুলি অপ্টিমাইজ করুন এবং একটি অভিযোজিত গতিশীল প্যারামিটার সিস্টেম স্থাপন করুন
- মিথ্যা সংকেত ফিল্টার করতে আরও প্রযুক্তিগত সূচকের সাথে একত্রিত করুন
- আরও নমনীয় অর্থ ব্যবস্থাপনা সমাধান বিকাশ করুন
সারসংক্ষেপ
এটি একটি ভাল পরিকল্পিত এবং যৌক্তিক প্রবণতা অনুসরণ কৌশল. চলমান গড় ক্রসওভারের মাধ্যমে প্রবণতা ক্যাপচার করা, ঝুঁকি নিয়ন্ত্রণ করতে ATR ব্যবহার করা এবং একাধিক স্টপ-লস মেকানিজমের সাথে একত্রিত করা একটি সম্পূর্ণ ট্রেডিং সিস্টেম গঠন করে। কৌশলটির প্রধান সুবিধা হ'ল এর ব্যাপক ঝুঁকি নিয়ন্ত্রণ এবং উচ্চ মাত্রার কাস্টমাইজযোগ্যতা, তবে আপনাকে সত্যিকারের ট্রেডিংয়ে মিথ্যা সংকেত এবং লেনদেন খরচের সমস্যাগুলির দিকে মনোযোগ দিতে হবে। প্রস্তাবিত অপ্টিমাইজেশন দিকনির্দেশের মাধ্যমে কৌশলটির আরও উন্নতির জন্য জায়গা রয়েছে।
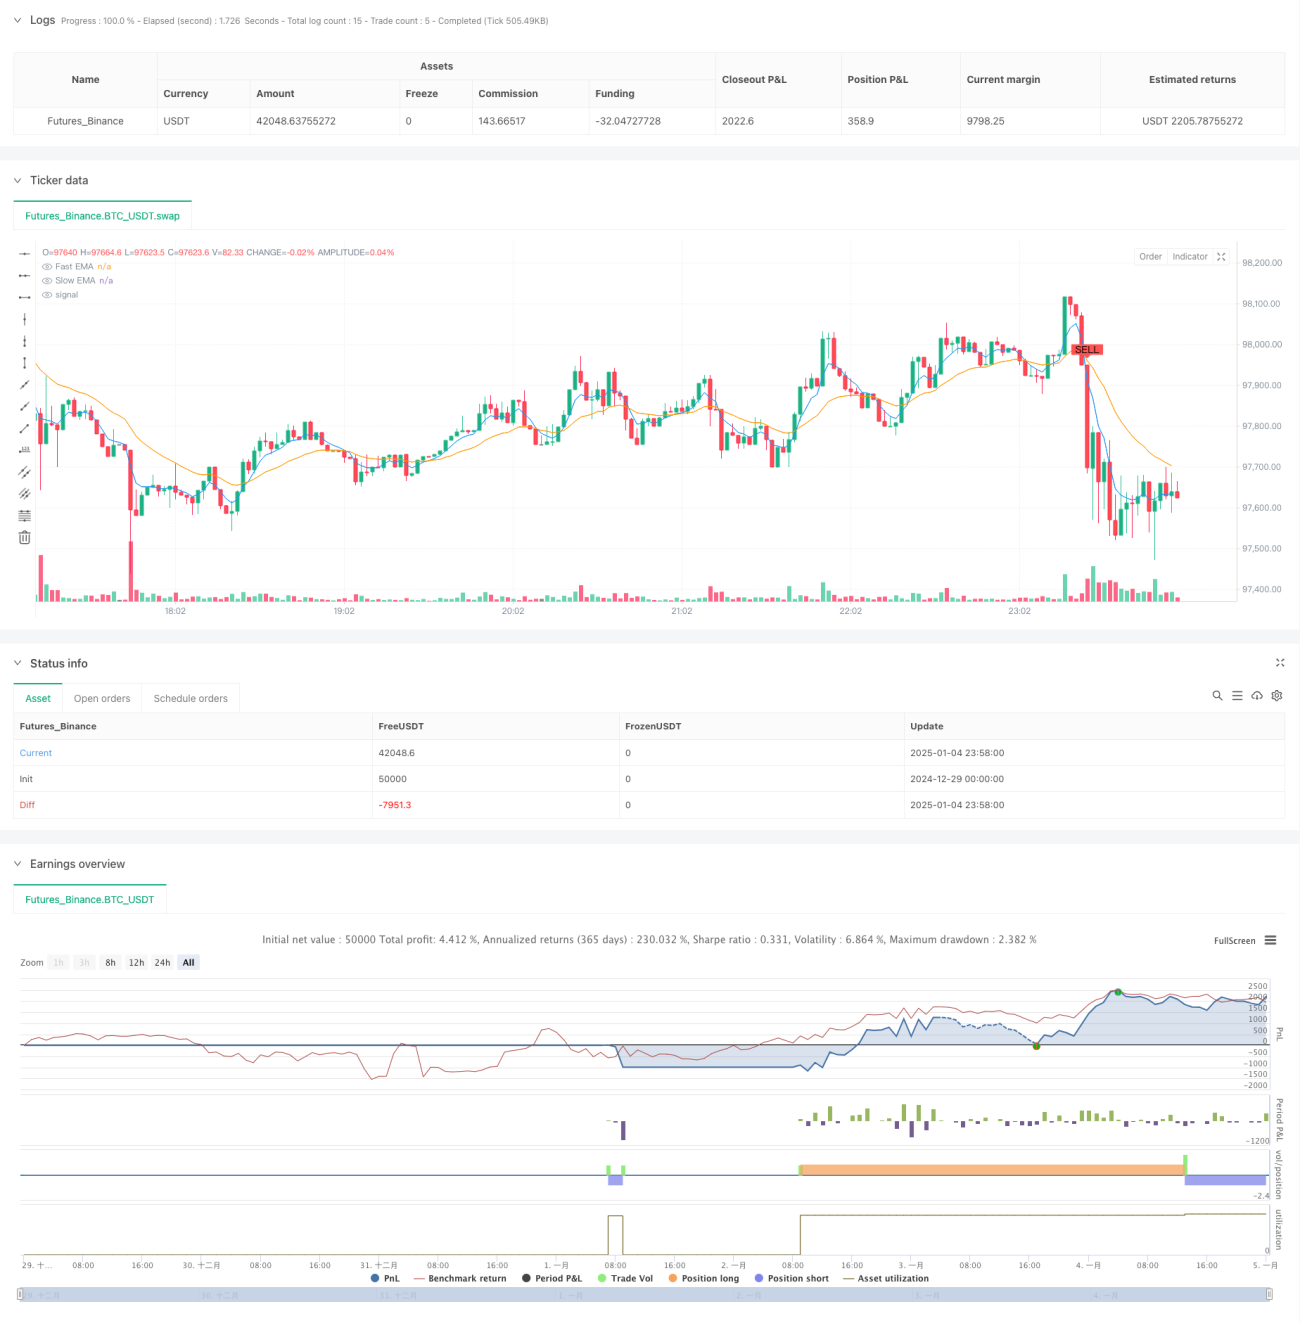
/*backtest
start: 2024-12-29 00:00:00
end: 2025-01-05 00:00:00
period: 2m
basePeriod: 2m
exchanges: [{"eid":"Futures_Binance","currency":"BTC_USDT"}]
*/

// This Pine Script™ code is subject to the terms of the Mozilla Public License 2.0 at https://mozilla.org/MPL/2.0/
// © jesusperezguitarra89

//@version=6- 1