ডুয়েল টেকনিক্যাল ইন্ডিকেটর মোমেন্টাম রিভার্সাল ট্রেডিং স্ট্র্যাটেজি রিস্ক ম্যানেজমেন্ট সিস্টেমের সাথে মিলিত

ওভারভিউ
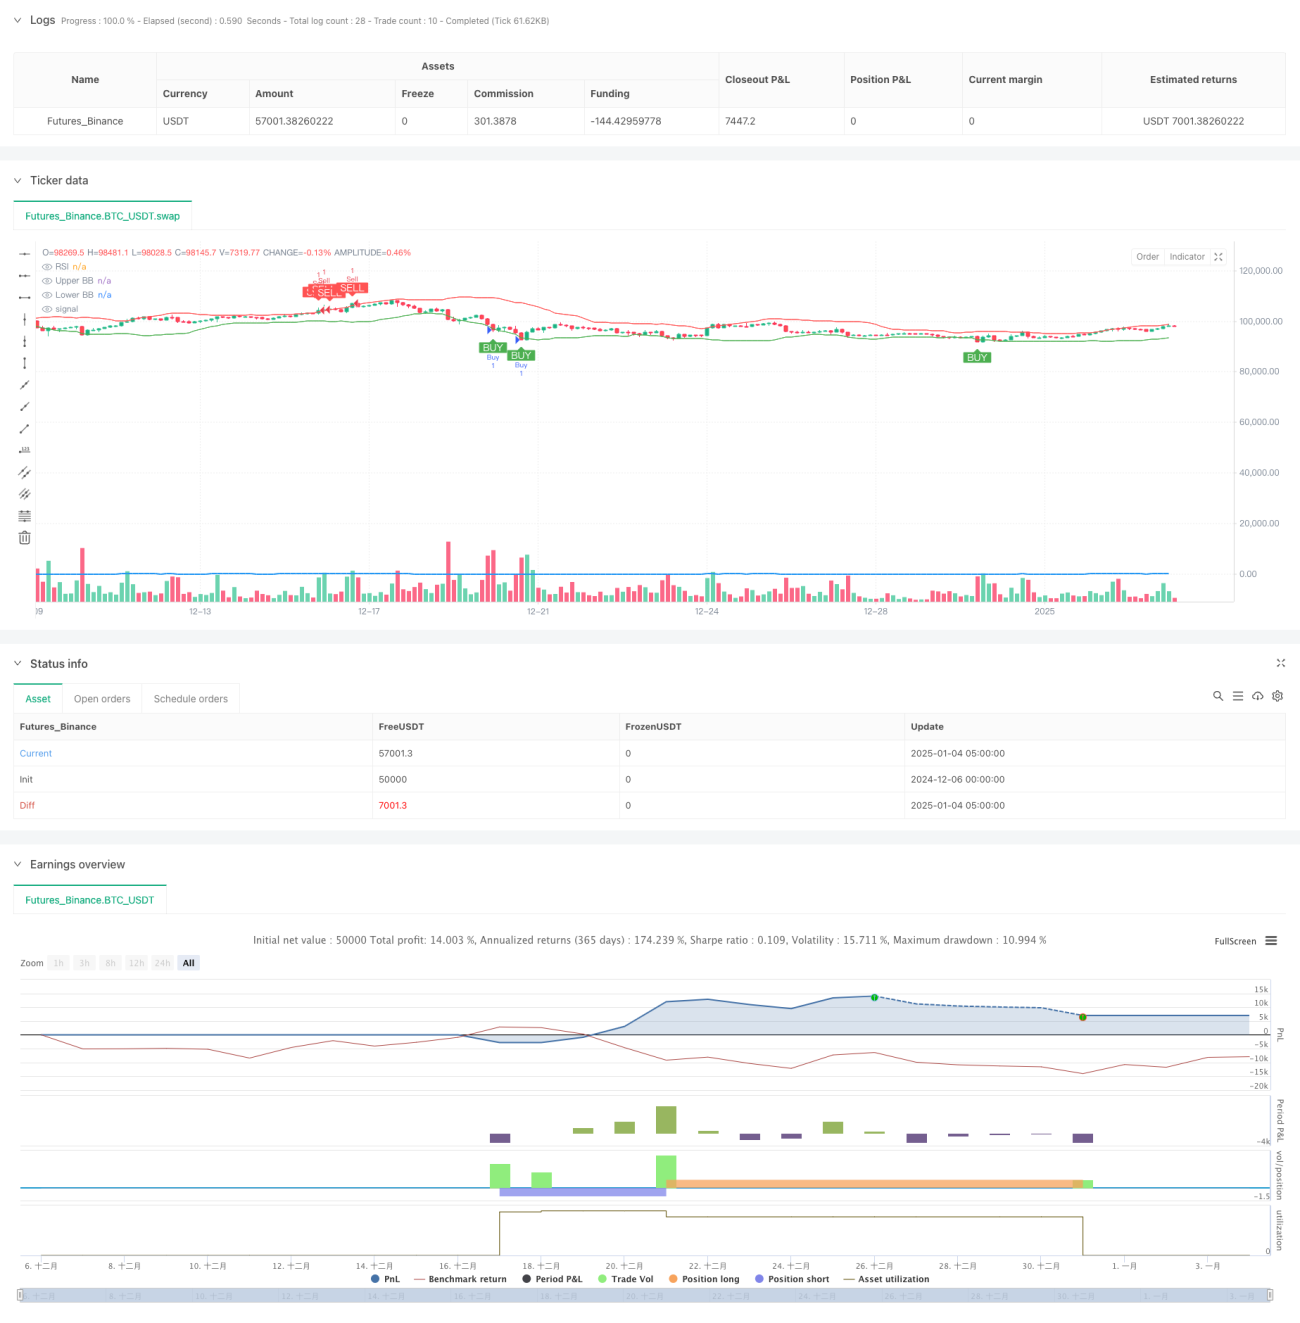
এই কৌশলটি একটি মোমেন্টাম রিভার্সাল ট্রেডিং সিস্টেম যা RSI এবং বলিঞ্জার ব্যান্ডের দ্বৈত প্রযুক্তিগত সূচকগুলিকে একত্রিত করে অতিরিক্ত কেনা এবং অতিবিক্রীত এলাকা চিহ্নিত করে বাণিজ্য করার জন্য। কৌশলটি 1:2-এর ঝুঁকি-থেকে-সুবিধা অনুপাত গ্রহণ করে এবং ঝুঁকি নিয়ন্ত্রণের জন্য ট্রেলিং স্টপ লসকে একত্রিত করে। মূল যুক্তি হল যখন RSI এবং বলিঞ্জার ব্যান্ড একই সময়ে অতিরিক্ত কেনা বা বেশি বিক্রি হওয়া সংকেত দেখা যায় তখন ট্রেড করা এবং কঠোর ঝুঁকি ব্যবস্থাপনার মাধ্যমে তহবিল রক্ষা করা।
কৌশল নীতি
কৌশলটি 14-পিরিয়ড RSI এবং 20-পিরিয়ড বলিঙ্গার ব্যান্ডগুলিকে প্রধান সূচক হিসাবে ব্যবহার করে। কেনার শর্ত একই সময়ে পূরণ করতে হবে: RSI 30 এর নিচে (অতি বিক্রিত) এবং দাম নিম্ন বলিংগার ব্যান্ড ট্র্যাকের ছোঁয়া বা নীচে। বিক্রির শর্ত একই সময়ে পূরণ করতে হবে: RSI 70 এর উপরে (অতি কেনা) এবং দাম উপরের বলিঙ্গার ব্যান্ডের উপরে বা ছুঁয়েছে। সিস্টেমটি চলমান স্টপ লস হিসাবে 5 K লাইনের সর্বোচ্চ/সর্বনিম্ন পয়েন্ট ব্যবহার করে এবং স্টপ লাভের অবস্থান স্টপ লসের দূরত্বের দ্বিগুণ, এবং 1:2 এর ঝুঁকি-সুবিধা অনুপাত কঠোরভাবে প্রয়োগ করে।
কৌশলগত সুবিধা
- দ্বৈত প্রযুক্তিগত নির্দেশক ফিল্টারিং সিগন্যালের গুণমান উন্নত করে এবং মিথ্যা সংকেত হ্রাস করে
- বাজারের আরও ব্যাপক দৃষ্টিভঙ্গি প্রদান করতে ভরবেগ এবং অস্থিরতা সূচককে একত্রিত করে
- কঠোর ঝুঁকি নিয়ন্ত্রণ ব্যবস্থা, যার মধ্যে রয়েছে ট্রেইলিং স্টপ লস এবং স্থির ঝুঁকি-রিটার্ন অনুপাত
- সিস্টেমটি সম্পূর্ণ স্বয়ংক্রিয়, মানুষের মানসিক হস্তক্ষেপ দূর করে
- কৌশল যুক্তি পরিষ্কার এবং বোঝা সহজ এবং বজায় রাখা
কৌশলগত ঝুঁকি
- ট্রেন্ডিং মার্কেটে স্টপ লস ঘন ঘন ঘটতে পারে
- দ্বৈত অবস্থা কিছু ট্রেডিং সুযোগ মিস করতে পারে
- ফিক্সড RSI এবং বলিঞ্জার ব্যান্ড প্যারামিটার সব বাজার পরিবেশে প্রযোজ্য নাও হতে পারে
- ট্রেলিং স্টপ অস্থির বাজারে অকাল প্রস্থান হতে পারে
- ক্রমাগত লোকসান মোকাবেলা করার জন্য সঠিক অর্থ ব্যবস্থাপনা প্রয়োজন
কৌশল অপ্টিমাইজেশনের দিকনির্দেশনা
- বাজারের অস্থিরতা অনুযায়ী সূচক প্যারামিটারগুলিকে গতিশীলভাবে সামঞ্জস্য করার জন্য একটি অভিযোজিত পরামিতি প্রক্রিয়া চালু করা হচ্ছে
- প্রবণতা ফিল্টার যোগ করা হয়েছে শক্তিশালী প্রবণতায় বিপরীতমুখী লেনদেন বিরাম দিতে
- একটি গতিশীল ঝুঁকি-সুবিধা অনুপাত সিস্টেম বিকাশ করুন যা বাজারের অবস্থার উপর ভিত্তি করে সামঞ্জস্য করে
- সংকেত নির্ভরযোগ্যতা উন্নত করতে একটি ট্রেডিং ভলিউম নিশ্চিতকরণ প্রক্রিয়া যোগ করুন
- আরও নমনীয় স্টপ লস প্রক্রিয়া বাস্তবায়ন করুন, যেমন ট্রেইলিং স্টপ লস বা টাইম স্টপ লস
সারসংক্ষেপ
এটি একটি সম্পূর্ণ কাঠামোগত বিপরীতমুখী ট্রেডিং কৌশল যা সঠিকতা উন্নত করতে দ্বৈত প্রযুক্তিগত সূচক ব্যবহার করে এবং কঠোর ঝুঁকি ব্যবস্থাপনা নিযুক্ত করে। যদিও কৌশলটি সহজ এবং স্বজ্ঞাত, এটি একটি পরিপক্ক ট্রেডিং সিস্টেমের জন্য প্রয়োজনীয় মূল উপাদানগুলি ধারণ করে। প্রস্তাবিত অপ্টিমাইজেশন দিকনির্দেশের মাধ্যমে এই কৌশলটির আরও উন্নতির জন্য জায়গা রয়েছে। প্রকৃত ট্রেডিংয়ে, প্রথমে পর্যাপ্ত ব্যাকটেস্টিং এবং প্যারামিটার অপ্টিমাইজেশন পরিচালনা করার পরামর্শ দেওয়া হয়।
- 1