দীর্ঘমেয়াদী প্রবণতা SMA চলমান গড় ক্রসওভার পরিমাণগত কৌশল

ওভারভিউ
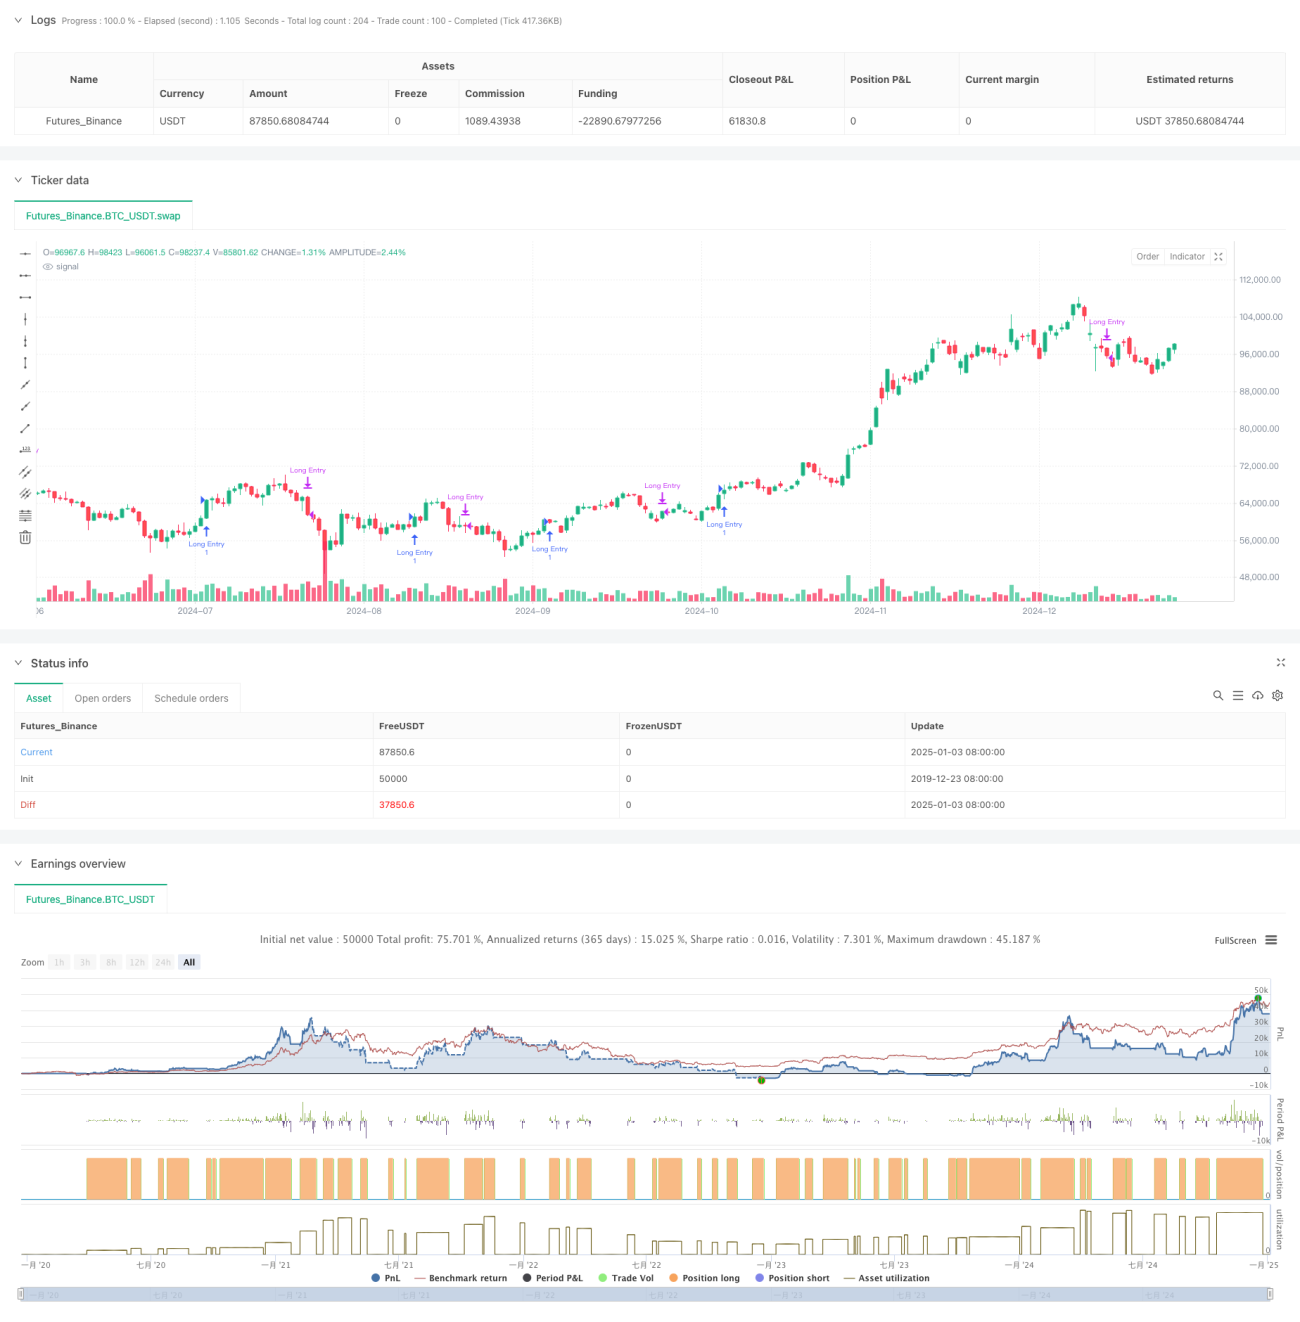
এই কৌশলটি মাল্টি-পিরিয়ড সিম্পল মুভিং এভারেজ (SMA) ক্রসওভার সিগন্যালের উপর ভিত্তি করে একটি পরিমাণগত ট্রেডিং সিস্টেম। এটি প্রাথমিকভাবে একটি দীর্ঘমেয়াদী আপট্রেন্ডের মধ্যে স্বল্প-মেয়াদী রিট্রেসমেন্ট সুযোগ চিহ্নিত করে ব্যবসা করে। কৌশলটি পাঁচটি পিরিয়ডের এসএমএ সূচক ব্যবহার করে, 5-দিন, 10-দিন, 20-দিন, 60-দিন এবং 120-দিন, অবস্থানের সম্পর্ক এবং চলমান গড়ের ক্রস সংকেতের মাধ্যমে বাজারের প্রবণতা এবং ট্রেডিং টাইমিং বিচার করতে।
কৌশল নীতি
কৌশলটির মূল যুক্তিতে নিম্নলিখিত মূল অংশগুলি অন্তর্ভুক্ত রয়েছে:
- দীর্ঘমেয়াদী প্রবণতা SMA20 এবং SMA60 এর আপেক্ষিক অবস্থান দ্বারা বিচার করা হয় যখন SMA20 SMA60 এর উপরে থাকে, এটি নিশ্চিত করা হয় যে বাজার একটি উর্ধ্বমুখী প্রবণতায় রয়েছে।
- দীর্ঘমেয়াদী ঊর্ধ্বমুখী প্রবণতা নিশ্চিত করার প্রেক্ষাপটে, যখন স্বল্প-মেয়াদী SMA5 SMA20-এর নীচে থেকে উপরে রিবাউন্ড করে, তখন একটি ক্রয় সংকেত ট্রিগার হয়। এটি ইঙ্গিত দেয় যে বাজার একটি আপট্রেন্ডে স্বল্পমেয়াদী পুলব্যাকের পরে পুনরুদ্ধার করছে।
- যখন SMA20 SMA5 অতিক্রম করে, একটি বন্ধ সংকেত ট্রিগার হয়। এটি ইঙ্গিত দেয় যে স্বল্পমেয়াদী ঊর্ধ্বমুখী গতিবেগ দুর্বল হয়ে পড়েছে এবং সামঞ্জস্যের সময়কাল প্রবেশ করতে পারে।
- কৌশলটিতে একটি টাইম ফিল্টার ফাংশনও রয়েছে, যা ব্যাকটেস্টিংয়ের সময়সীমা সীমিত করতে পারে এবং কৌশলটির নমনীয়তা উন্নত করতে পারে।
কৌশলগত সুবিধা
- কৌশল যুক্তি পরিষ্কার এবং সহজ, বোঝা এবং প্রয়োগ করা সহজ এবং জটিল গণনা প্রক্রিয়া জড়িত নয়।
- মাল্টি-পিরিয়ড মুভিং এভারেজের সম্মিলিত ব্যবহারের মাধ্যমে, বাজারের গোলমাল কার্যকরভাবে ফিল্টার করা যায় এবং ট্রেডিং সিগন্যালের নির্ভরযোগ্যতা উন্নত করা যায়।
- এই কৌশলটি ট্রেন্ডিং মার্কেটে পুলব্যাক সুযোগের উপর দৃষ্টি নিবদ্ধ করে, যা "ট্রেন্ড ট্রেডিং" এর মূল ধারণার সাথে সঙ্গতিপূর্ণ।
- EMA এর পরিবর্তে SMA ব্যবহার করা মূল্য পরিবর্তনের প্রতি সংবেদনশীলতা হ্রাস করে এবং মিথ্যা সংকেত হ্রাস করে।
- প্রবেশ এবং প্রস্থান যুক্তি স্পষ্ট, যা মৃত্যুদন্ড এবং ঝুঁকি নিয়ন্ত্রণ সহজতর করে।
কৌশলগত ঝুঁকি
- চলমান গড় সিস্টেমে হিস্টেরেসিস রয়েছে, যা আদর্শ প্রবেশ এবং প্রস্থান সময়ের চেয়ে কম হতে পারে।
- একটি অস্থির বাজারে, ঘন ঘন চলমান গড় ক্রসওভারগুলি অনেক বেশি মিথ্যা সংকেত তৈরি করতে পারে।
- কৌশলটিতে একটি অস্থিরতা ফিল্টারিং পদ্ধতির অভাব রয়েছে এবং উচ্চ অস্থিরতার সময়কালে এটি রিট্রেসমেন্টের বেশি ঝুঁকির সম্মুখীন হতে পারে।
- ট্রেডিং ভলিউমের মতো অন্যান্য প্রযুক্তিগত সূচকগুলির সহযোগিতা বিবেচনা না করে, সংকেতের নির্ভরযোগ্যতা উন্নত করা দরকার।
- ফিক্সড মুভিং এভারেজ প্যারামিটার সব বাজার পরিবেশের জন্য উপযুক্ত নাও হতে পারে।
কৌশল অপ্টিমাইজেশনের দিকনির্দেশনা
- অস্থিরতা ফিল্টার করতে ATR সূচক চালু করুন এবং যখন অস্থিরতা খুব বেশি হয় তখন ট্রেডিং এড়ান।
- ট্রেডিং সিগন্যালের নির্ভরযোগ্যতা উন্নত করতে একটি ট্রেডিং ভলিউম নিশ্চিতকরণ প্রক্রিয়া যোগ করুন।
- বিভিন্ন বাজারের পরিবেশে কৌশলটিকে আরও ভালভাবে মানিয়ে নিতে একটি অভিযোজিত চলমান গড় চক্র প্রক্রিয়া বিকাশ করুন।
- শক্তিশালী ট্রেন্ডে ট্রেডিং নিশ্চিত করতে ADX সূচকের মতো ট্রেন্ড শক্তি ফিল্টার যোগ করুন।
- স্টপ লস মেকানিজম উন্নত করুন, যেমন ট্রেলিং স্টপ লস যোগ করা, ঝুঁকিগুলিকে আরও ভালভাবে নিয়ন্ত্রণ করতে।
সারসংক্ষেপ
এই কৌশলটি একটি ট্রেডিং সিস্টেম তৈরি করতে মাল্টি-পিরিয়ড এসএমএ মুভিং এভারেজের সংমিশ্রণ ব্যবহার করে যা দীর্ঘমেয়াদী ঊর্ধ্বমুখী প্রবণতাগুলিতে কলব্যাকের সুযোগগুলি ক্যাপচার করার উপর ফোকাস করে। কৌশল নকশা সহজ এবং ব্যবহারিক, ভাল বোধগম্যতা এবং নির্বাহযোগ্যতা সঙ্গে. অপ্টিমাইজেশান ব্যবস্থা প্রবর্তন করে যেমন অস্থিরতা ফিল্টারিং এবং ট্রেডিং ভলিউম নিশ্চিতকরণ, কৌশলটির দৃঢ়তা এবং নির্ভরযোগ্যতা আরও উন্নত হবে বলে আশা করা হচ্ছে।
/*backtest
start: 2019-12-23 08:00:00
end: 2025-01-04 08:00:00
period: 1d
basePeriod: 1d
exchanges: [{"eid":"Futures_Binance","currency":"BTC_USDT"}]
*/

//@version=6
strategy("Long-Term Growing Stock Strategy", overlay=true)
// Date Range
// STEP 1. Create inputs that configure the backtest's date range- 1