উচ্চ-ফ্রিকোয়েন্সি ভলিউম মূল্য প্রবণতা ট্র্যাকিং এবং ট্রেডিং ভলিউম বিশ্লেষণ অভিযোজিত কৌশল

ওভারভিউ
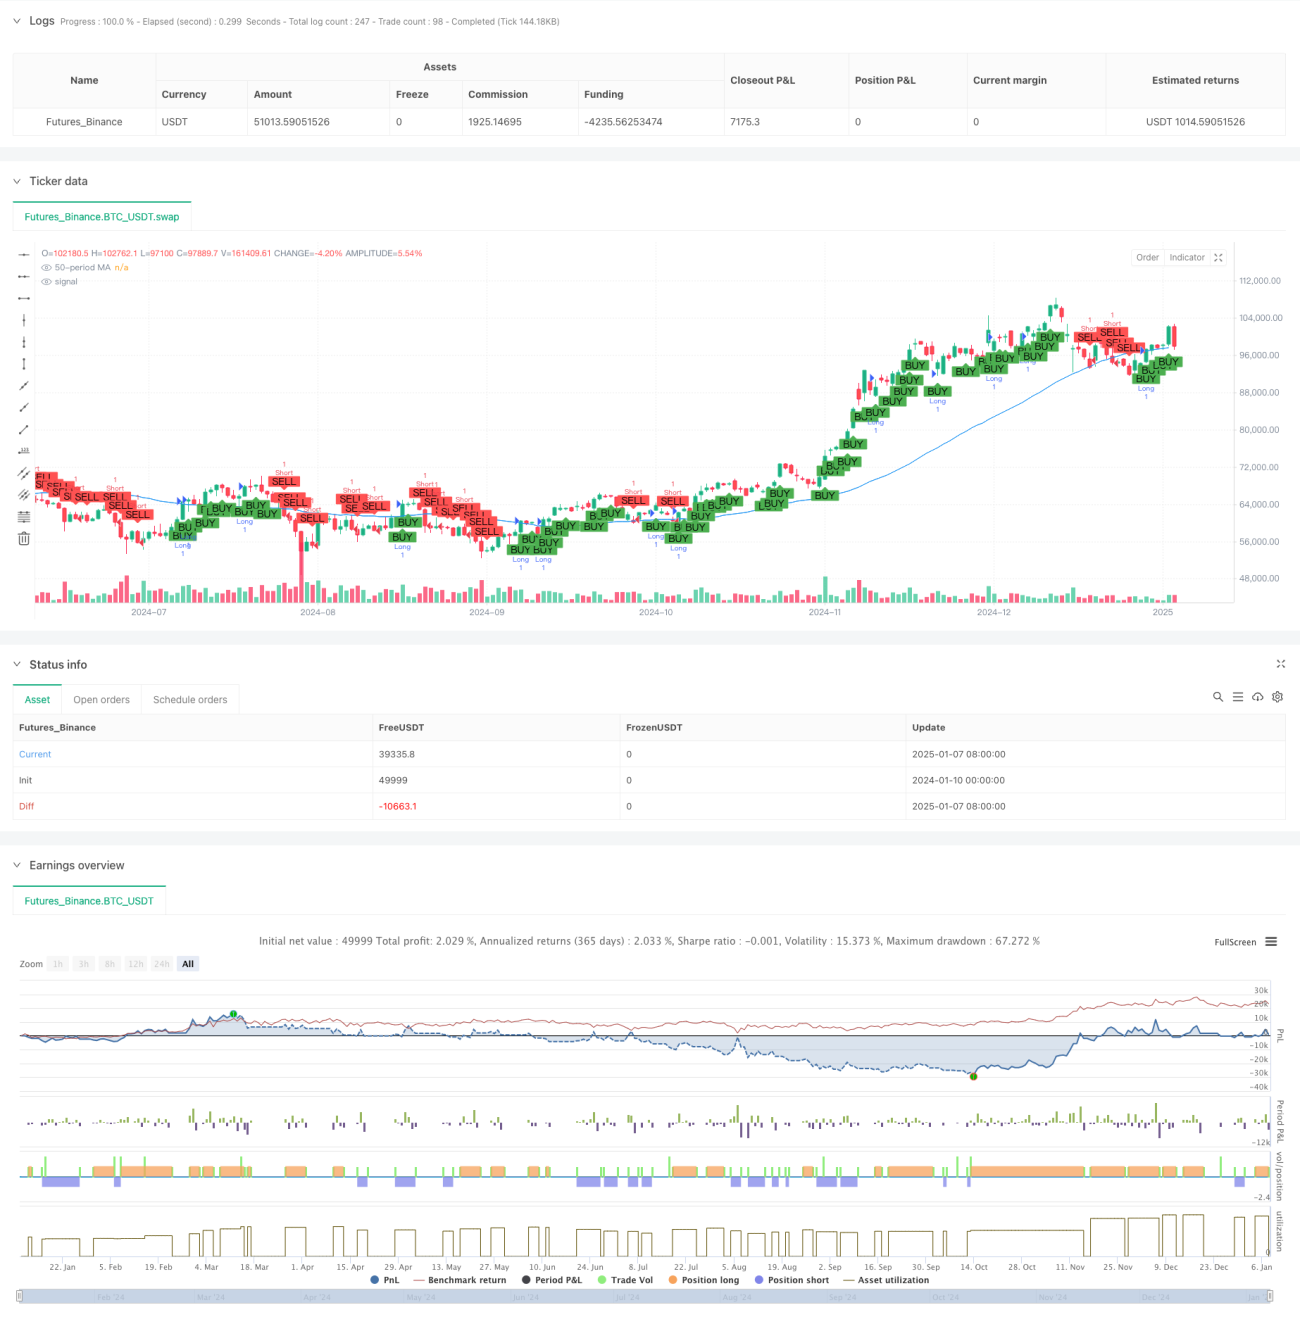
এই কৌশলটি একটি স্বয়ংক্রিয় ট্রেডিং সিস্টেম যা একটি 5-মিনিটের সময় ফ্রেমের উপর ভিত্তি করে যা চলমান গড় প্রবণতা অনুসরণ এবং ভলিউম বিশ্লেষণ পদ্ধতিগুলিকে একত্রিত করে। কৌশলটি বাজারের প্রবণতা নির্ধারণের জন্য 50-পিরিয়ড সিম্পল মুভিং এভারেজ (SMA) ব্যবহার করে এবং ট্রেডিং সিগন্যালের কার্যকারিতা যাচাই করার জন্য ভলিউম বিশ্লেষণও প্রবর্তন করে। সম্পূর্ণ স্বয়ংক্রিয় ট্রেডিং অর্জনের জন্য সিস্টেমটি নির্দিষ্ট স্টপ লস এবং লাভের লক্ষ্য গ্রহণ করে।
কৌশল নীতি
কৌশলটির মূল যুক্তিতে নিম্নলিখিত মূল উপাদানগুলি অন্তর্ভুক্ত রয়েছে:
- প্রবণতা শনাক্তকরণ: বাজারের দিকনির্দেশ নির্ধারণের জন্য 50-পিরিয়ড SMA ব্যবহার করুন যখন ক্লোজিং এভারেজের চেয়ে বেশি হয়, তখন এটি একটি ঊর্ধ্বমুখী প্রবণতা হিসেবে নির্ধারিত হয়। একই সময়ে, গত 30 মিনিটের (6 কে লাইন) মূল্যের প্রবণতার উপর ভিত্তি করে প্রবণতা নিশ্চিত করা হয়েছে।
- ট্রেডিং ভলিউম বিশ্লেষণ: মূল্যের ওঠানামার উপর ভিত্তি করে ক্রয়-বিক্রয় ভলিউম গণনা করুন এবং সমাপনী মূল্যের অবস্থান অনুযায়ী ক্রয় ভলিউম এবং বিক্রয় ভলিউমের প্রতিটি K লাইনের মধ্যে ট্রেডিং ভলিউম বরাদ্দ করুন।
- ট্রেডিং সিগন্যাল জেনারেশন: একটি ঊর্ধ্বমুখী প্রবণতায়, একটি দীর্ঘ সংকেত তৈরি হয় যখন ক্রয়ের পরিমাণ বিক্রির পরিমাণের চেয়ে বেশি হয়, একটি সংক্ষিপ্ত সংকেত তৈরি হয় যখন বিক্রির পরিমাণ কেনার পরিমাণ বেশি হয়।
- ঝুঁকি নিয়ন্ত্রণ: প্রতিটি ট্রেডের ঝুঁকি-পুরস্কার অনুপাত পরিচালনা করতে একটি 3% স্টপ লস এবং একটি 29% লাভ লক্ষ্য ব্যবহার করুন।
কৌশলগত সুবিধা
- বহুমাত্রিক প্রবণতা নিশ্চিতকরণ: চলমান গড় এবং স্বল্পমেয়াদী মূল্য প্রবণতাগুলিকে একত্রিত করে প্রবণতা দ্বিগুণ নিশ্চিত করার মাধ্যমে, প্রবণতা বিচারের নির্ভুলতা উন্নত হয়।
- ভলিউম যাচাইকরণ: কম ভলিউম পরিবেশে মিথ্যা সাফল্য এড়াতে একটি ট্রেডিং সিগন্যাল ফিল্টার হিসাবে ভলিউম বিশ্লেষণ প্রবর্তন করুন।
- উন্নত ঝুঁকি ব্যবস্থাপনা: ক্লিয়ার স্টপ লস এবং লাভের লক্ষ্যমাত্রা কার্যকরভাবে একক লেনদেনের ঝুঁকি নিয়ন্ত্রণ করতে সেট করা হয়েছে।
- শক্তিশালী অভিযোজনযোগ্যতা: কৌশলটি বাজারের অবস্থা অনুসারে স্বয়ংক্রিয়ভাবে লেনদেনের দিক সামঞ্জস্য করতে পারে এবং বিভিন্ন বাজার পরিবেশের সাথে খাপ খাইয়ে নিতে পারে।
কৌশলগত ঝুঁকি
- শক মার্কেটের ঝুঁকি: সাইডওয়ে শক মার্কেটে, ঘন ঘন মিথ্যা ব্রেকথ্রু সংকেত ঘটতে পারে, যার ফলে ক্রমাগত স্টপ লস হতে পারে।
- স্লিপেজের ঝুঁকি: উচ্চ-ফ্রিকোয়েন্সি ট্রেডিংয়ে, আপনি বড় স্লিপেজের সম্মুখীন হতে পারেন, যা প্রকৃত সম্পাদনের প্রভাবকে প্রভাবিত করবে।
- পরামিতি সংবেদনশীলতা: কৌশলগত প্রভাব পরামিতিগুলির প্রতি সংবেদনশীল যেমন চলমান গড় সময়কাল এবং ট্রেডিং ভলিউম গণনা সময়কাল।
- বাজারের পরিবেশের উপর নির্ভরতা: কৌশলটি একটি পরিষ্কার প্রবণতা বাজারে আরও ভাল পারফর্ম করে, তবে ট্রেন্ড ট্রানজিশন সময়কালে এটি একটি বড় রিট্রেসমেন্ট অনুভব করতে পারে।
কৌশল অপ্টিমাইজেশনের দিকনির্দেশনা
- ডায়নামিক প্যারামিটার অপ্টিমাইজেশান: বাজারের অস্থিরতা অনুসারে চলমান গড় সময়কাল এবং ট্রেডিং ভলিউম গণনা সময়কালকে গতিশীলভাবে সামঞ্জস্য করার জন্য একটি অভিযোজিত প্যারামিটার প্রক্রিয়া চালু করা যেতে পারে।
- বাজার পরিবেশ ফিল্টারিং যোগ করুন: অস্থিরতা সূচক বা প্রবণতা শক্তি সূচক যোগ করুন যাতে বাজারের অনুপযুক্ত পরিবেশে স্বয়ংক্রিয়ভাবে ট্রেডিং বন্ধ করা যায়।
- স্টপ লস মেকানিজম উন্নত করুন: ঝুঁকি নিয়ন্ত্রণের নমনীয়তা উন্নত করতে আপনি গতিশীল স্টপ লস, যেমন ট্রেলিং স্টপ লস বা ATR-ভিত্তিক স্টপ লস ব্যবহার করতে পারেন।
- অপ্টিমাইজ সিগন্যাল জেনারেশন লজিক: আপনি সিগন্যালের নির্ভরযোগ্যতা উন্নত করতে ক্রস-ভ্যালিডেশনের জন্য আরও প্রযুক্তিগত সূচক যোগ করার কথা বিবেচনা করতে পারেন।
সারসংক্ষেপ
এই কৌশলটি ট্রেন্ড ট্র্যাকিং এবং ভলিউম বিশ্লেষণকে একত্রিত করে একটি সম্পূর্ণ উচ্চ-ফ্রিকোয়েন্সি ট্রেডিং সিস্টেম তৈরি করে। কৌশলটির প্রধান সুবিধা বহুমাত্রিক সংকেত নিশ্চিতকরণ প্রক্রিয়া এবং সম্পূর্ণ ঝুঁকি নিয়ন্ত্রণ ব্যবস্থার মধ্যে রয়েছে। যদিও কিছু অন্তর্নিহিত ঝুঁকি রয়েছে, প্রস্তাবিত অপ্টিমাইজেশন দিকনির্দেশের মাধ্যমে কৌশলটির স্থায়িত্ব এবং অভিযোজনযোগ্যতা আরও উন্নত করা যেতে পারে। যুক্তিসঙ্গত প্যারামিটার অপ্টিমাইজেশান এবং ঝুঁকি ব্যবস্থাপনার মাধ্যমে স্পষ্ট প্রবণতা সহ একটি বাজার পরিবেশে কাজ করার জন্য কৌশলটি স্থিতিশীল ট্রেডিং ফলাফল অর্জন করবে বলে আশা করা হচ্ছে।
/*backtest
start: 2024-01-10 00:00:00
end: 2025-01-08 08:00:00
period: 1d
basePeriod: 1d
exchanges: [{"eid":"Futures_Binance","currency":"BTC_USDT","balance":49999}]
*/

// This Pine Script™ code is subject to the terms of the Mozilla Public License 2.0 at https://mozilla.org/MPL/2.0/
// © Jerryorange

//@version=6- 1