ট্রেডিং কৌশল অনুসরণ করে ডায়নামিক নিউরাল নেটওয়ার্ক RSI ট্রেন্ড

ওভারভিউ
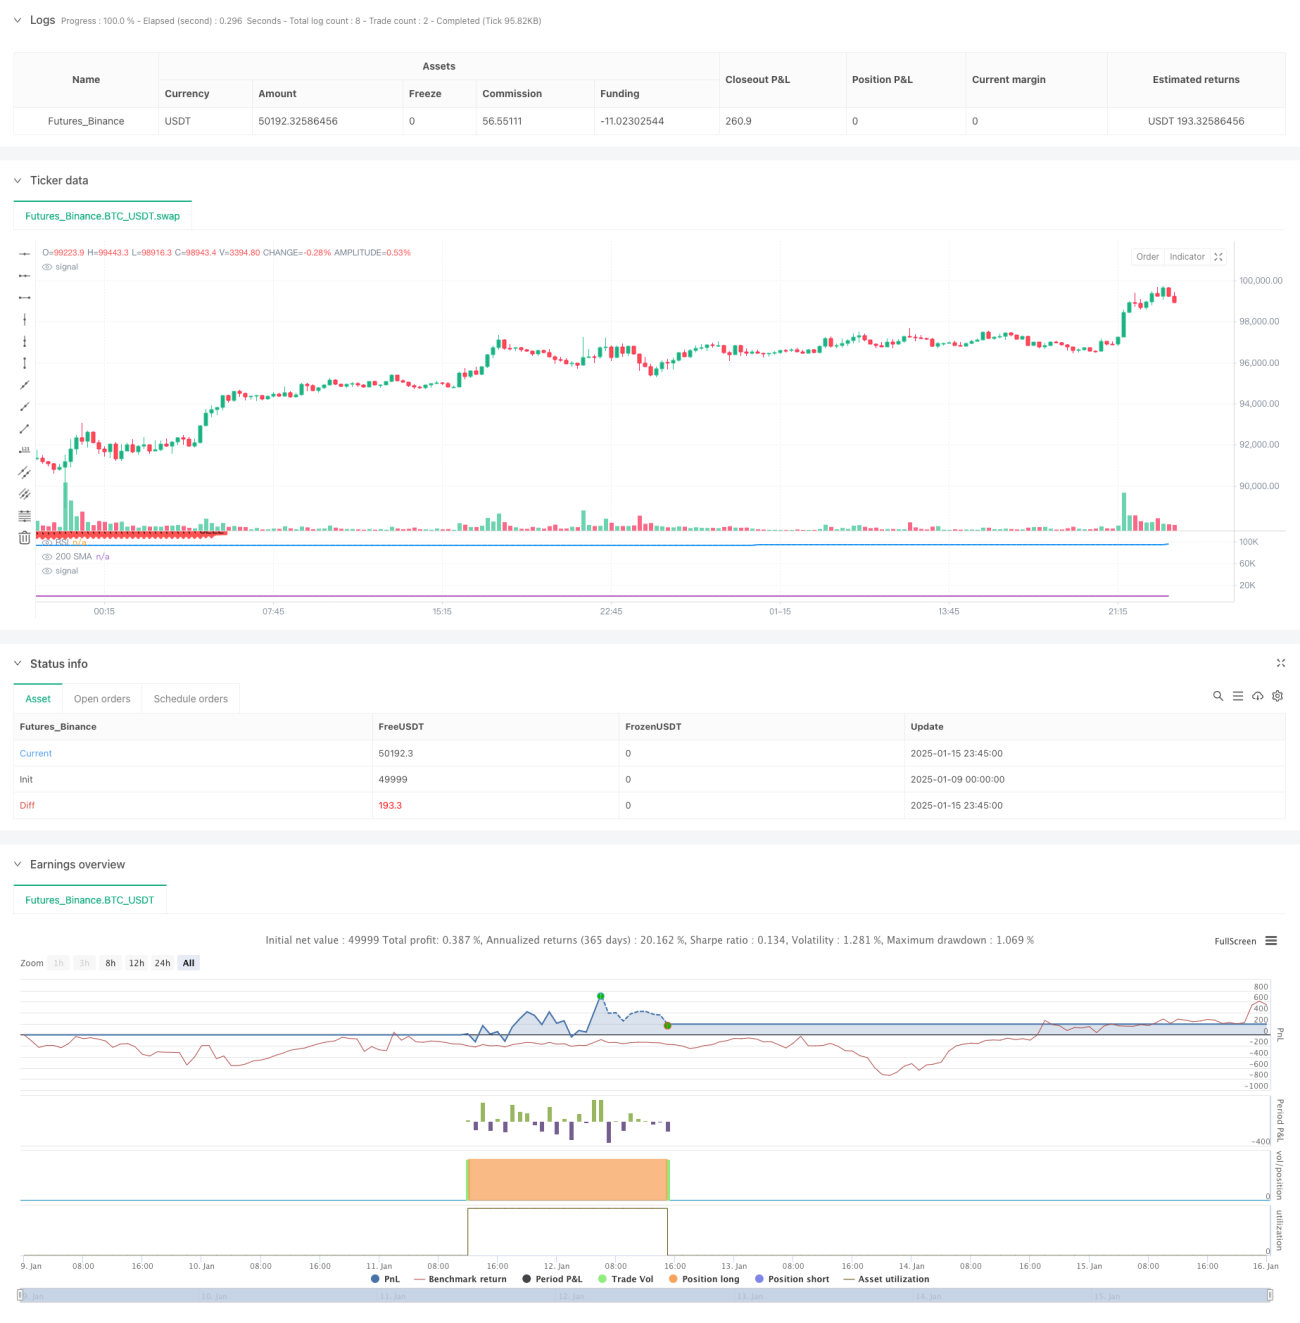
এই কৌশলটি চলমান গড়, RSI সূচক এবং ট্রেলিং স্টপের উপর ভিত্তি করে একটি পরিমাণগত ট্রেডিং সিস্টেম। এটি প্রযুক্তিগত বিশ্লেষণে প্রবণতা ট্র্যাকিং এবং মোমেন্টাম ইন্ডিকেটরকে একত্রিত করে কঠোর প্রবেশ এবং প্রস্থান শর্ত নির্ধারণ করে ঝুঁকি-নিয়ন্ত্রণযোগ্য ট্রেডিং অর্জন করতে। কৌশলটির মূল যুক্তি হল ঊর্ধ্বমুখী প্রবণতার সময় বাজারে প্রবেশের জন্য ওভারবিক্রীত সুযোগ সন্ধান করা এবং লাভ রক্ষা করার জন্য ট্রেলিং স্টপ ব্যবহার করা।
কৌশল নীতি
কৌশলটি ট্রেন্ড জাজমেন্টের জন্য বেসলাইন হিসাবে 200-দিনের সহজ মুভিং এভারেজ (SMA) ব্যবহার করে এবং ট্রেডিং সিগন্যাল তৈরি করতে আপেক্ষিক শক্তি সূচক (RSI) এর সাথে এটিকে একত্রিত করে। বিশেষভাবে:
- সাধারণ প্রবণতা নির্ধারণ করতে 200-দিনের মুভিং এভারেজ ব্যবহার করুন যদি দাম চলমান গড় থেকে বেশি হয়।
- যখন RSI প্রিসেট থ্রেশহোল্ড (ডিফল্ট 40) থেকে কম হয়, তখন একটি ওভারসোল্ড সংকেত বিবেচনা করা হয়
- যখন উপরের দুটি শর্ত একই সময়ে পূরণ হয় এবং শেষ অবস্থান বন্ধ হওয়ার পর থেকে অপেক্ষার সময়কাল (ডিফল্ট 10 দিন) অতিক্রান্ত হয়, তখন দীর্ঘ সংকেতটি ট্রিগার হয়।
- পজিশন পিরিয়ডে ট্রেলিং স্টপ লস (ডিফল্ট 5%) এর মাধ্যমে গতিশীলভাবে লাভ রক্ষা করুন
- যখন দাম ট্রেলিং স্টপ প্রাইসের নিচে নেমে আসে বা 200-দিনের মুভিং এভারেজের নিচে নেমে যায়, তখন পজিশন বন্ধ হয়ে যাবে এবং প্রস্থান করা হবে।
কৌশলগত সুবিধা
- ট্রেডিং সঠিকতা উন্নত করতে ট্রেন্ড এবং মোমেন্টাম ডুয়াল ফিল্টারিং একত্রিত করুন
- কার্যকরভাবে লাভ লক করতে ট্রেলিং স্টপ লস মেকানিজম ব্যবহার করুন
- ঘন ঘন লেনদেন এড়াতে লেনদেনের ব্যবধান সেট করুন
- পরামিতিগুলি অত্যন্ত সামঞ্জস্যযোগ্য এবং বিভিন্ন বাজারের পরিবেশে অভিযোজিত।
- লেনদেনের যুক্তি স্পষ্ট, বোঝা এবং কার্যকর করা সহজ
- সহজ গণনা এবং উচ্চ কম্পিউটিং দক্ষতা
কৌশলগত ঝুঁকি
- চলমান গড় ব্যবধানের ফলে প্রবেশ এবং প্রস্থান সংকেত বিলম্বিত হতে পারে
- RSI সূচকটি অস্থির বাজারে মিথ্যা সংকেত তৈরি করতে পারে
- ফিক্সড শতাংশ ট্রেলিং স্টপ সব বাজার পরিবেশের জন্য উপযুক্ত নাও হতে পারে
- প্যারামিটার অপ্টিমাইজেশান ওভারফিটিং হতে পারে
- অত্যন্ত অস্থির বাজারে বড় রিট্রেসমেন্ট ভোগ করতে পারে
কৌশল অপ্টিমাইজেশনের দিকনির্দেশনা
- উদ্বায়ীতা অভিযোজিত ট্রেলিং স্টপ শতাংশ প্রবর্তন
- সহায়ক নিশ্চিতকরণ হিসাবে ভলিউম সূচক যোগ করুন
- সংবেদনশীলতা উন্নত করতে সাধারণ চলমান গড়ের পরিবর্তে সূচকীয় চলমান গড় ব্যবহার করুন
- ব্যবসার সুযোগ অপ্টিমাইজ করতে বাজারের অনুভূতি সূচক যোগ করুন
- গতিশীল পরামিতি অপ্টিমাইজেশান প্রক্রিয়া বিকাশ
- মাল্টি-সাইকেল কৌশল নিশ্চিতকরণ প্রক্রিয়া যোগ করুন
সারসংক্ষেপ
এটি সম্পূর্ণ কাঠামো এবং স্পষ্ট যুক্তি সহ একটি পরিমাণগত ট্রেডিং কৌশল। একাধিক প্রযুক্তিগত সূচক একত্রিত করে, এটি ঝুঁকি নিয়ন্ত্রণ করার সময় স্থিতিশীল রিটার্ন অনুসরণ করে। যদিও অপ্টিমাইজেশনের জন্য কিছু জায়গা আছে, মৌলিক কাঠামোর ভাল ব্যবহারিকতা এবং মাপযোগ্যতা রয়েছে। কৌশলটি মাঝারি এবং দীর্ঘমেয়াদী বিনিয়োগকারীদের জন্য উপযুক্ত এবং বিভিন্ন বাজারের পরিবেশের সাথে ভাল অভিযোজনযোগ্যতা রয়েছে।
- 1