মাল্টি-টেকনিক্যাল ইন্ডিকেটর ক্রসওভার মোমেন্টাম ট্রেন্ড অনুসরণ কৌশল

ওভারভিউ
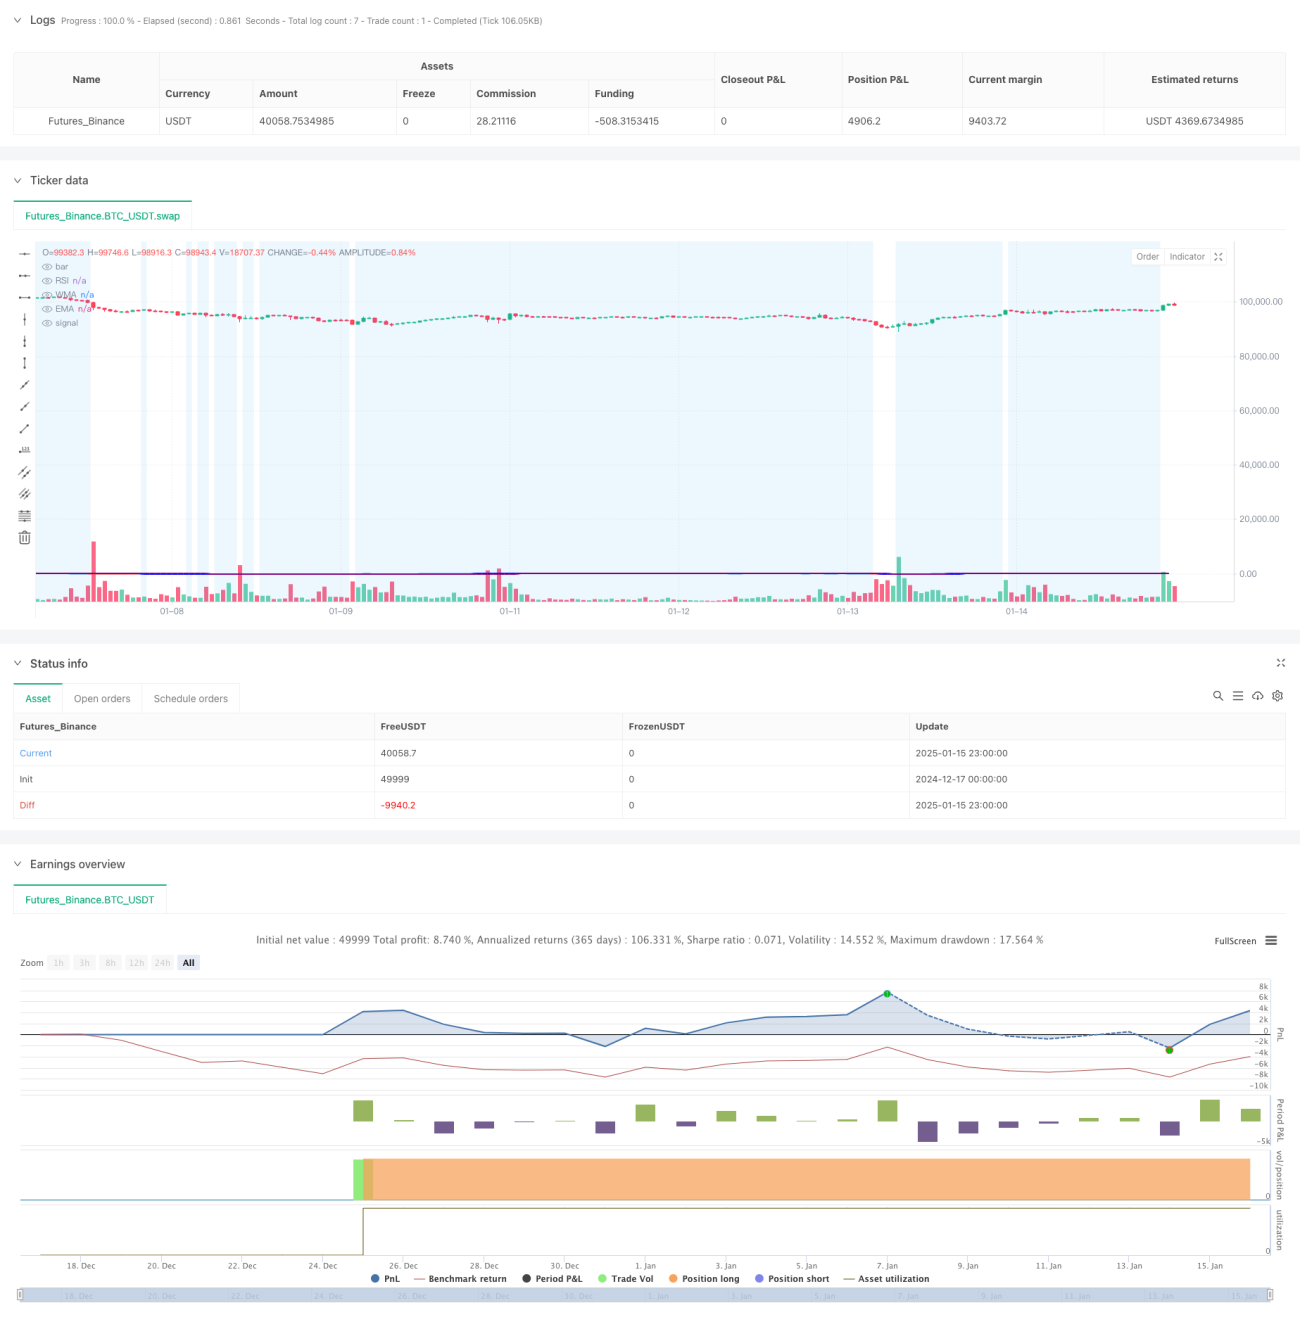
এই কৌশলটি একটি ট্রেন্ড অনুসরণ করে ট্রেডিং সিস্টেম যা রিলেটিভ স্ট্রেংথ ইনডেক্স (RSI), ওয়েটেড মুভিং এভারেজ (WMA), এবং এক্সপোনেনশিয়াল মুভিং এভারেজ (EMA) কে একত্রিত করে। কৌশলটি ট্রেন্ডিং পয়েন্টে বাজারের গতির পরিবর্তনগুলি ক্যাপচার করতে একাধিক প্রযুক্তিগত সূচক ব্যবহার করে, যার ফলে ট্রেডিং সংকেত তৈরি হয়। সিস্টেমটি ট্রেন্ডের দিকনির্দেশ নিশ্চিত করতে WMA এবং EMA-এর সংযোগস্থল ব্যবহার করে, এবং ট্রেডিংয়ের সঠিকতা উন্নত করতে বাজারের অবস্থা ফিল্টার করতে RSI সূচকের সাথে এটিকে একত্রিত করে।
কৌশল নীতি
কৌশলটির মূল যুক্তি নিম্নলিখিত মূল উপাদানগুলির উপর ভিত্তি করে:
- RSI সূচকটি 14-পিরিয়ড ব্যবহার করে গণনা করা হয় এবং বাজারের অতিরিক্ত কেনা এবং ওভারবিক্রীত অবস্থা পরিমাপ করতে ব্যবহৃত হয়।
- 45-পিরিয়ড WMA এবং 89-পিরিয়ড EMA-এর ক্রসওভার ট্রেন্ড ট্রানজিশন নিশ্চিত করতে ব্যবহৃত হয়
- ভর্তির শর্ত:
- দীর্ঘ সংকেত: WMA EMA এবং RSI <50 অতিক্রম করে
- সংক্ষিপ্ত সংকেত: WMA EMA এবং RSI>50 অতিক্রম করে
- সিস্টেমটি RSI-এর রঙ পরিবর্তনের মাধ্যমে বাজারের অবস্থা কল্পনা করে এটি RSI>70 হলে সবুজ এবং <30 হলে লাল দেখায়।
- নিরপেক্ষ এলাকা সনাক্ত করতে সাহায্য করার জন্য RSI 30-70 পরিসরের মধ্যে একটি নীল পটভূমি সেট করুন
কৌশলগত সুবিধা
- একাধিক প্রযুক্তিগত সূচকের সমন্বয় ট্রেডিং সংকেতের নির্ভরযোগ্যতা উন্নত করে
- WMA সাম্প্রতিক মূল্য পরিবর্তনের জন্য আরও প্রতিক্রিয়াশীল, যখন EMA দীর্ঘমেয়াদী প্রবণতা ট্র্যাক রাখে
- অত্যধিক অস্থির বাজারে মিথ্যা সংকেত এড়াতে RSI একটি ফিল্টার হিসাবে কাজ করে।
- ভিজ্যুয়াল ইন্টারফেস ডিজাইন ট্রেডারদের স্বজ্ঞাতভাবে বাজারের অবস্থা বিচার করতে সাহায্য করে
- সম্ভাব্য ট্রেডিং সুযোগ সম্পর্কে ব্যবসায়ীদের অবিলম্বে অবহিত করার জন্য একটি সম্পূর্ণ সতর্কতা ব্যবস্থা রয়েছে
কৌশলগত ঝুঁকি
- পার্শ্ববর্তী বাজারে ঘন ঘন মিথ্যা ব্রেকআউট সংকেত ঘটতে পারে
- চলমান গড়ের পিছিয়ে থাকা প্রকৃতির ফলে প্রবেশের সময় কিছুটা বিলম্বিত হতে পারে
- RSI থ্রেশহোল্ডের জন্য স্থির সেটিংস সব বাজার পরিবেশে কাজ নাও করতে পারে
- অস্থিরতার কারণ বিবেচনা করতে ব্যর্থতা উচ্চ অস্থিরতার সময়কালে ঝুঁকি বাড়াতে পারে
- স্টপ-লস এবং টেক-প্রফিট মেকানিজমের অভাব তহবিল ব্যবস্থাপনার কার্যকারিতাকে প্রভাবিত করতে পারে
কৌশল অপ্টিমাইজেশনের দিকনির্দেশনা
- অভিযোজিত RSI থ্রেশহোল্ড প্রবর্তন করুন এবং বাজারের ওঠানামা অনুযায়ী এটি গতিশীলভাবে সামঞ্জস্য করুন
- অবস্থানের আকার নিয়ন্ত্রণ করতে ATR সূচক যোগ করুন এবং গতিশীল স্টপ লস সেট করুন
- WMA এবং EMA এর সাইকেল সেটিংস অপ্টিমাইজ করুন এবং বিভিন্ন সময় ফ্রেম অনুযায়ী সেগুলি সামঞ্জস্য করার কথা বিবেচনা করুন
- গৌণ নিশ্চিতকরণ সংকেত হিসাবে ভলিউম সূচক যোগ করুন
- আরো জটিল পজিশন ম্যানেজমেন্ট সিস্টেম প্রয়োগ করুন, যেমন পিরামিড-টাইপ অবস্থান সংযোজন এবং হ্রাস
সারসংক্ষেপ
এটি একাধিক প্রযুক্তিগত সূচকের উপর ভিত্তি করে একটি প্রবণতা অনুসরণ করে, এটি লেনদেনের স্থিতিশীলতা নিশ্চিত করার সাথে সাথে RSI, WMA এবং EMA এর সম্মিলিত ব্যবহারের মাধ্যমে। যদিও হিস্টেরেসিস এবং মিথ্যা সংকেতের একটি নির্দিষ্ট ঝুঁকি রয়েছে, যুক্তিসঙ্গত অপ্টিমাইজেশন এবং ঝুঁকি ব্যবস্থাপনার ব্যবস্থার মাধ্যমে, এই কৌশলটির ভাল ব্যবহারিক মূল্য এবং সম্প্রসারণের জন্য জায়গা রয়েছে।
- 1