
ওভারভিউ
এটি একটি প্রবণতা ট্র্যাকিং কৌশল যা একাধিক প্রযুক্তিগত সূচক এবং ঝুঁকি ব্যবস্থাপনার উপর ভিত্তি করে। এই কৌশলটি বাজারের প্রবণতা সনাক্ত করতে এবং গতিশীল ক্ষতি, অবস্থান পরিচালনা এবং মাসিক সর্বাধিক প্রত্যাহারের সীমাবদ্ধতার মতো ঝুঁকি নিয়ন্ত্রণের মাধ্যমে তহবিল সুরক্ষার জন্য একাধিক প্রযুক্তিগত সূচক যেমন চলমান গড়, তুলনামূলকভাবে দুর্বল সূচক ((আরএসআই) এবং গতিশীল সূচক ((ডিএমআই) এর সমন্বিত ব্যবহার করে। কৌশলটির মূলটি হ'ল প্রবণতার কার্যকারিতা নিশ্চিত করার জন্য বহু-মাত্রিক প্রযুক্তিগত সূচকগুলি ব্যবহার করা হয়, যখন ঝুঁকি ফাঁকগুলি কঠোরভাবে নিয়ন্ত্রণ করা হয়।
কৌশল নীতি
এই কৌশলটি প্রবণতা সনাক্তকরণের জন্য একাধিক স্তরের ব্যবস্থা গ্রহণ করেঃ
- 8/21/50 চক্রীয় সূচক দ্বারা চলমান গড় ((EMA) দ্বারা প্রবণতা দিক বিচার
- প্রবণতা ফিল্টার হিসাবে মূল্য চ্যানেলের মধ্যবর্তী লাইন ব্যবহার করা
- আরএসআই গড় লাইন ((৫ টি চক্র) সহ 35-65 এর মধ্যে চলাফেরা মিথ্যা ব্রেকআউটগুলিকে ফিল্টার করে
- DMI সূচক ((14 চক্র) দ্বারা প্রবণতা শক্তি নিশ্চিত করুন
- প্রবণতার ধারাবাহিকতা যাচাই করার জন্য গতিশীলতা সূচক (৮টি চক্র) এবং লেনদেনের পরিমাণ বাড়ানো
- ATR-ভিত্তিক ডায়নামিক স্টপ লস ব্যবহার করে ঝুঁকি নিয়ন্ত্রণ
- প্রতি লেনদেনের জন্য প্রাথমিক মূলধনের ৫% ঝুঁকি নিয়ে স্থির ঝুঁকি মডেলের পজিশন ম্যানেজমেন্ট
- অতিরিক্ত ক্ষতি এড়াতে 10% এর একটি মাসিক সর্বাধিক প্রত্যাহারের সীমা সেট করুন
কৌশলগত সুবিধা
- একাধিক প্রযুক্তিগত সূচকের ক্রস-যাচাইকরণ প্রবণতা নির্ধারণের সঠিকতা বাড়ায়
- ডায়নামিক স্টপ-অফ ব্যবস্থা একক লেনদেনের ঝুঁকি কার্যকরভাবে নিয়ন্ত্রণ করে
- স্থির ঝুঁকির পজিশন ম্যানেজমেন্ট পদ্ধতি অর্থের ব্যবহারকে আরও যুক্তিসঙ্গত করে তোলে
- মাসিক সর্বাধিক প্রত্যাহারের সীমাবদ্ধতা সিস্টেমিক ঝুঁকি সুরক্ষা প্রদান করে
- প্রবণতা সনাক্তকরণে নির্ভরযোগ্যতা বাড়ানোর জন্য সমন্বিত ট্র্যাফিক সূচক
- ২ঃ১ লাভ-ক্ষতি অনুপাতের সেটিং দীর্ঘমেয়াদী লাভজনকতা বাড়ায়
কৌশলগত ঝুঁকি
- একাধিক সূচক ব্যবহারের ফলে সংকেত বিলম্বিত হতে পারে
- বাজারের অস্থিরতার মধ্যে প্রায়শই মিথ্যা সংকেত তৈরি হতে পারে
- স্থির ঝুঁকি মডেলগুলি তীব্র ওঠানামা করার সময় যথেষ্ট নমনীয় নাও হতে পারে
- মাসিক প্রত্যাহারের সীমাবদ্ধতা গুরুত্বপূর্ণ ব্যবসায়ের সুযোগ হারাতে পারে
- ট্রেন্ডের বিপরীতমুখী প্রবণতা বড় ধরনের বিপর্যয় ঘটাতে পারে
কৌশল অপ্টিমাইজেশনের দিকনির্দেশনা
- বিভিন্ন বাজারের অবস্থার সাথে খাপ খাইয়ে নেওয়ার জন্য স্বনির্ধারিত সূচক প্যারামিটার প্রবর্তন করা
- বাজারের অস্থিরতার সাথে সামঞ্জস্য রেখে আরও নমনীয় পজিশন ম্যানেজমেন্ট পরিকল্পনা তৈরি করা
- প্রবণতা শক্তির পরিমাণগত মূল্যায়ন, প্রবেশের সময়কে অনুকূলিতকরণ
- স্মার্ট মাসিক ঝুঁকি ব্যবস্থাপনা
- বিভিন্ন বাজারের অবস্থার সাথে কৌশলগত প্যারামিটারগুলি সামঞ্জস্য করার জন্য একটি বাজার পরিবেশ সনাক্তকরণ মডিউল যুক্ত করুন
সারসংক্ষেপ
এই কৌশলটি মাল্টি-ডাইমেনশনাল প্রযুক্তিগত সূচকগুলির সমন্বিত প্রয়োগের মাধ্যমে একটি অপেক্ষাকৃত সম্পূর্ণ প্রবণতা-ট্র্যাকিং ট্রেডিং সিস্টেম তৈরি করে। কৌশলটির সুবিধাটি হ'ল এর সম্পূর্ণ ঝুঁকি ব্যবস্থাপনার কাঠামো, যার মধ্যে রয়েছে গতিশীল স্টপ লস, পজিশন ম্যানেজমেন্ট এবং প্রত্যাহার নিয়ন্ত্রণ। যদিও কিছু পিছিয়ে যাওয়ার ঝুঁকি রয়েছে, তবে অপ্টিমাইজেশন এবং উন্নতির মাধ্যমে কৌশলটি বিভিন্ন বাজারের পরিবেশে স্থিতিশীল পারফরম্যান্স বজায় রাখার সম্ভাবনা রয়েছে। কৌশলটির মূল যুক্তি বজায় রাখার সাথে সাথে এটির বাজারের পরিবেশের সাথে অভিযোজনযোগ্যতা বাড়ানোর মূল চাবিকাঠি।
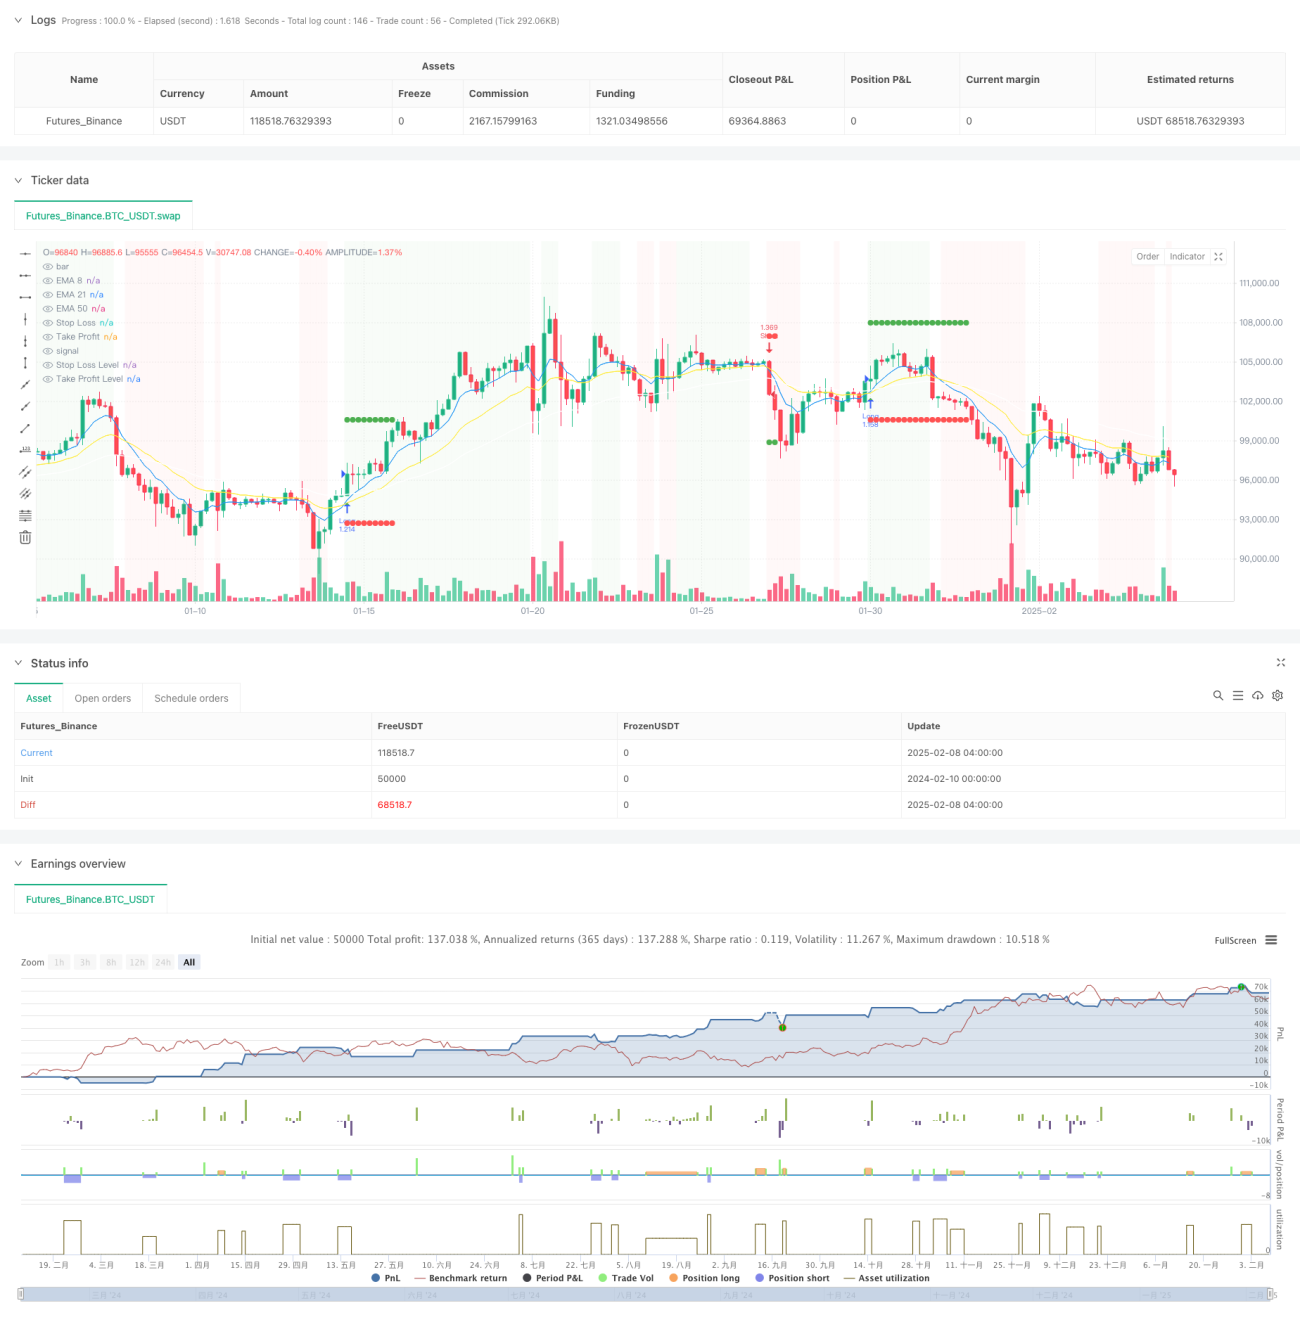
/*backtest
start: 2024-02-10 00:00:00
end: 2025-02-08 08:00:00
period: 4h
basePeriod: 4h
exchanges: [{"eid":"Futures_Binance","currency":"BTC_USDT"}]
*/

//@version=5
strategy("High Win-Rate Crypto Strategy with Drawdown Limit", overlay=true, initial_capital=10000, default_qty_type=strategy.fixed, process_orders_on_close=true)

// Moving Averages- 1