
ওভারভিউ
এটি একটি ট্রিপল মিডল লাইন ট্রেন্ড ট্র্যাকিং কৌশল যা অলিভার ভ্যালেজ ট্রেডিং পদ্ধতির উপর ভিত্তি করে। এই কৌশলটি বাজারের প্রবণতা এবং ব্যবসায়ের সুযোগগুলি সনাক্ত করতে 20 পিরিয়ড, 50 পিরিয়ড এবং 200 পিরিয়ডের চলমান গড়ের ক্রস সিগন্যাল ব্যবহার করে। 200 পিরিয়ডের মিডল লাইনটি প্রধান প্রবণতা ফিল্টার হিসাবে কাজ করে এবং 20 পিরিয়ড এবং 50 পিরিয়ডের মিডল লাইনের ক্রসগুলি নির্দিষ্ট ট্রেডিং সিগন্যাল তৈরি করতে ব্যবহৃত হয়। কৌশলটি ঝুঁকি ব্যবস্থাপনার বৈশিষ্ট্যগুলি অন্তর্ভুক্ত করে, যার মধ্যে স্টপ লস এবং স্টপ লস সেটিং রয়েছে।
কৌশল নীতি
এই কৌশলটির মূল তত্ত্বের তিনটি স্তর রয়েছেঃ
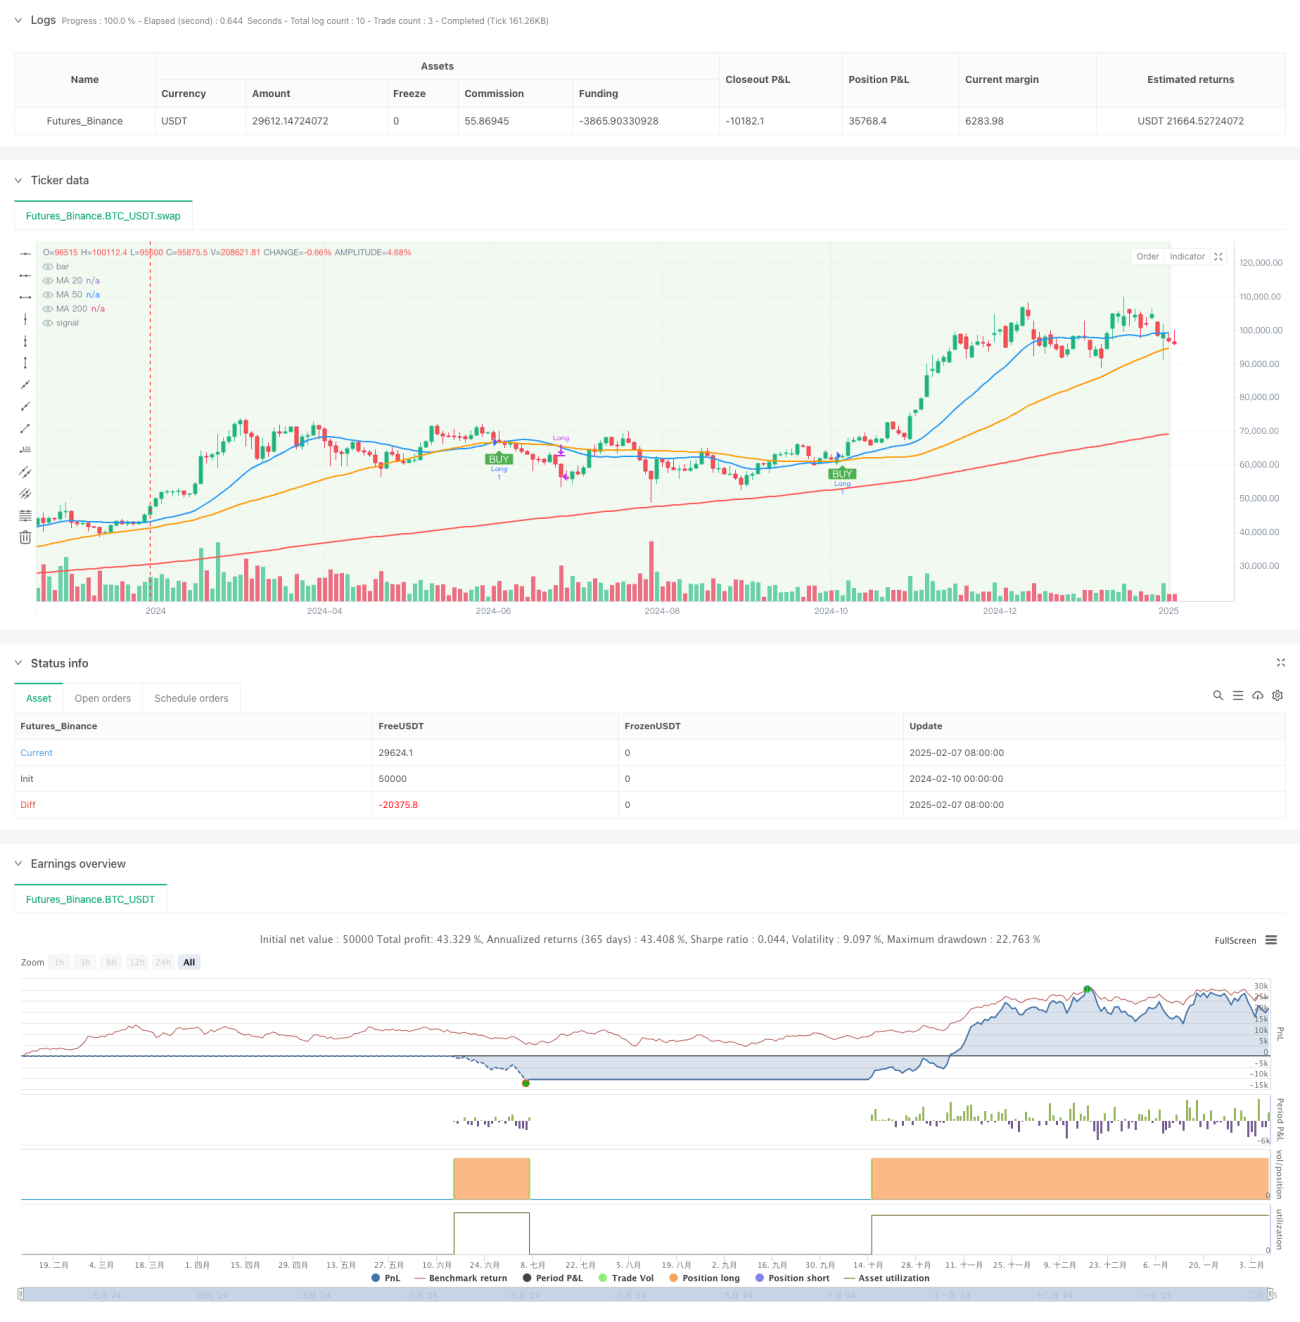
- প্রবণতা সনাক্তকরণঃ 200 পিরিয়ডের গড় লাইনকে প্রবণতা সীমানা হিসাবে ব্যবহার করুন। যখন দাম 200 গড়ের উপরে থাকে, তখন এটি একটি উচ্চ প্রবণতা হিসাবে বিবেচিত হয়; যখন দাম 200 গড়ের নীচে থাকে, তখন এটি একটি নিম্ন প্রবণতা হিসাবে বিবেচিত হয়।
- ট্রেডিং সিগন্যালঃ একটি ট্রেন্ডিং ট্রেন্ডে, যখন 20 পিরিয়ডের গড় লাইন 50 পিরিয়ডের গড় লাইন অতিক্রম করে তখন একটি মাল্টিসিগন্যাল ট্রিগার করা হয়। একটি ট্রেন্ডিং ট্রেন্ডে, যখন 20 পিরিয়ডের গড় লাইন 50 পিরিয়ডের গড় লাইন অতিক্রম করে তখন একটি ফাঁকা সিগন্যাল ট্রিগার করা হয়।
- ঝুঁকি নিয়ন্ত্রণঃ কৌশলটি ডিফল্টরূপে 2% স্টপ লস এবং 4% স্টপ স্টপ সেট করে এবং বিপরীত ক্রস সিগন্যালের সময় স্বয়ংক্রিয়ভাবে পজিশন ক্লিয়ার করে।
কৌশলগত সুবিধা
- মাল্টিপল কনফার্মেশন মেকানিজম: তিনটি সমান্তরাল লাইন ব্যবহার করে একটি আরো নির্ভরযোগ্য ট্রেডিং সিগন্যাল প্রদান করে।
- প্রবণতা ফিল্টারঃ 200 সমান্তরাল প্রবণতা ফিল্টার কার্যকরভাবে মিথ্যা বিপর্যয়ের ঝুঁকি হ্রাস করে।
- নমনীয়তাঃ এসএমএ এবং ইএমএর মধ্যে স্যুইচিং সমর্থন করে, বিভিন্ন বাজারের বৈশিষ্ট্য অনুসারে প্যারামিটারগুলি সামঞ্জস্য করা যায়।
- ঝুঁকি ব্যবস্থাপনা উন্নতঃ অন্তর্নির্মিত ক্ষতি প্রতিরোধ ব্যবস্থা, তহবিল সুরক্ষা।
- ভিজ্যুয়ালাইজেশনঃ ব্যাকগ্রাউন্ডের রঙ পরিবর্তন করে ট্রেন্ডের অবস্থা প্রদর্শন করুন।
কৌশলগত ঝুঁকি
- পিছিয়ে পড়াঃ মুভিং এভারেজ মূলত একটি পিছিয়ে পড়া সূচক, যা প্রবেশাধিকার বা প্রস্থান সময়কে কিছুটা বিলম্বিত করতে পারে।
- অস্থির বাজার প্রযোজ্য নয়ঃ ঘন ঘন সমান্তরাল ক্রসিংয়ের ফলে ভুল সংকেত তৈরি হতে পারে।
- স্থির ক্ষতির ঝুঁকিঃ স্থির শতাংশ ক্ষতির ব্যবহার সমস্ত বাজার পরিস্থিতিতে উপযুক্ত নাও হতে পারে।
- প্যারামিটার সংবেদনশীলতাঃ বিভিন্ন গড়-রেখা সময়কালের সেটিংগুলি উল্লেখযোগ্যভাবে ভিন্ন ফলাফল তৈরি করতে পারে।
কৌশল অপ্টিমাইজেশনের দিকনির্দেশনা
- ট্র্যাফিক বিশ্লেষণের প্রবর্তনঃ ট্র্যাফিক নিশ্চিতকরণ সূচক যুক্ত করা যেতে পারে, যা সংকেতের নির্ভরযোগ্যতা বাড়ায়।
- ডায়নামিক স্টপ লস সেটিংঃ এটিআর বা ওলট-পালট রেট সূচক ব্যবহার করে ডায়নামিকভাবে স্টপ লস পজিশনে সামঞ্জস্য করার কথা বিবেচনা করুন।
- প্রবণতা শক্তিবৃদ্ধি ফিল্টারঃ প্রবণতা শক্তিবৃদ্ধি সূচক যেমন ADX, দুর্বল প্রবণতা পরিবেশে ফিল্টার করা যেতে পারে।
- প্রবেশের সময়কে অনুকূলিতকরণঃ প্রবেশের সঠিকতা বাড়ানোর জন্য মূল্যের আকৃতি এবং প্রতিরোধের স্তরকে সমর্থন করুন।
- টাইম ফিল্টার যুক্ত করুনঃ ট্রেডিংয়ের সময় উইন্ডো সেট করুন, যাতে বেশি অস্থিরতার সময়গুলি এড়ানো যায়।
সারসংক্ষেপ
এটি একটি কাঠামোগত, যুক্তিসঙ্গতভাবে সুস্পষ্ট প্রবণতা ট্র্যাকিং কৌশল। ট্রিপল গড়ের সমন্বয় দ্বারা প্রবণতা সনাক্তকরণের নির্ভুলতা নিশ্চিত করা এবং স্পষ্ট ট্রেডিং সংকেত সরবরাহ করা হয়। কৌশলটির ঝুঁকি ব্যবস্থাপনার প্রক্রিয়াটি তুলনামূলকভাবে নিখুঁত, তবে এখনও অপ্টিমাইজেশনের জায়গা রয়েছে। ব্যবসায়ীদের রিয়েল-টাইমে ব্যবহারের আগে পর্যাপ্ত প্রতিক্রিয়া দেওয়ার পরামর্শ দেওয়া হয় এবং নির্দিষ্ট ট্রেডিং জাতের বৈশিষ্ট্য অনুসারে প্যারামিটার সেটগুলি সামঞ্জস্য করা উচিত।
- 1