
ওভারভিউ
এই কৌশলটি একটি উদ্ভাবনী প্রবণতা ট্র্যাকিং ট্রেডিং সিস্টেম যা বাজারের প্রবণতা সনাক্ত করার জন্য ডাবল-লেয়ার সূচক সমতলীকরণ প্রযুক্তি ব্যবহার করে। এই সিস্টেমটি মূল্যের ডেটাতে বিশেষ সূচক সমতলীকরণ প্রক্রিয়াকরণের মাধ্যমে দুটি প্রবণতা লাইন তৈরি করে যা বাজারের স্বল্প ও দীর্ঘমেয়াদী চলন ধরার জন্য ব্যবহৃত হয়। সিস্টেমটি একটি সম্পূর্ণ ঝুঁকি ব্যবস্থাপনা মডিউল অন্তর্ভুক্ত করে, যার মধ্যে স্টপ স্টপ লস সেটিংস এবং নমনীয় পজিশন ম্যানেজমেন্ট বৈশিষ্ট্য রয়েছে।
কৌশল নীতি
কৌশলটির কেন্দ্রবিন্দু হল এর অনন্য দ্বি-স্তরীয় সূচক মসৃণকরণ অ্যালগরিদম। প্রথমত, সিস্টেমটি ক্লোজিং মূল্যের উপর ওজনযুক্ত চিকিত্সা করে, যা গণনা করা হয় ((সর্বোচ্চ মূল্য + সর্বনিম্ন মূল্য + 2*এটি বাজারের গোলমালের প্রভাবকে হ্রাস করতে পারে। তারপরে, কাস্টমাইজড সূচকীয় মসৃণকরণ ফাংশন দ্বারা, যথাক্রমে 9 টি এবং 30 টি চক্রের মসৃণকরণ কার্ভ গণনা করা হয়। যখন স্বল্পমেয়াদী কার্ভ দীর্ঘমেয়াদী কার্ভকে অতিক্রম করে, তখন সিস্টেমটি একটি ট্রেডিং সংকেত তৈরি করে।
কৌশলগত সুবিধা
- সিগন্যাল জেনারেশন প্রক্রিয়াটি পরিষ্কার, ক্লাসিক ট্রেন্ড ট্র্যাকিং ধারণাগুলি ব্যবহার করে, যা বোঝা এবং সম্পাদন করা সহজ।
- ডাবল-লেভেল ইন্ডেক্সাল ফ্ল্যাশ প্রযুক্তি কার্যকরভাবে বাজার শব্দ ফিল্টার করে এবং সংকেতের গুণমান উন্নত করে।
- একটি সম্পূর্ণ ঝুঁকি ব্যবস্থাপনা সিস্টেম, যার মধ্যে রয়েছে স্টপ লস এবং পজিশন ম্যানেজমেন্ট।
- সিস্টেমটি বিভিন্ন বাজারের পরিবেশের সাথে খাপ খাইয়ে নিতে পারে এবং বিভিন্ন ধরণের লেনদেনের জন্য উপযুক্ত।
- মার্কেটের দিকনির্দেশনা নির্ধারণে ব্যবসায়ীদের সহায়তা করার জন্য একটি স্পষ্ট দৃশ্যমান সূচক সরবরাহ করা হয়েছে।
কৌশলগত ঝুঁকি
- ক্রমাগত স্টপ ক্ষতির ফলে বাজারের ঝড়ের মধ্যে প্রায়শই মিথ্যা সংকেত তৈরি হতে পারে।
- ডিফল্টরূপে, 100% তহবিলের সাথে ট্রেড করুন, কারণ উচ্চতর লিভারেজ ঝুঁকিপূর্ণ।
- স্টপ-অফ-লস সেটিং যা নির্দিষ্ট পয়েন্টের উপর ভিত্তি করে করা হয় তা সব বাজারের জন্য উপযুক্ত নাও হতে পারে।
- সিস্টেমটি বাজারের তীব্র অস্থিরতার মধ্যে স্লাইড করতে পারে, যা কার্যকর কার্যকারিতা প্রভাবিত করে।
- ইতিহাসের পুনর্বিবেচনার ফলাফল ভবিষ্যতের কর্মক্ষমতার নিশ্চয়তা দেয় না।
কৌশল অপ্টিমাইজেশনের দিকনির্দেশনা
- স্টপ স্টপ লস পয়েন্টের গতিশীল সমন্বয় করার জন্য ওলট-পালট হার সূচক (যেমন ATR) প্রবর্তন করা হয়েছে।
- প্রবণতা-শক্তি ফিল্টার যুক্ত করুন এবং দুর্বল প্রবণতা পরিবেশে ট্রেডিং ফ্রিকোয়েন্সি হ্রাস করুন।
- মার্কেট এনভায়রনমেন্ট আইডেন্টিফিকেশন মডিউল যোগ করা হয়েছে, যা বাজারে স্বয়ংক্রিয়ভাবে কৌশলগত প্যারামিটারগুলিকে সামঞ্জস্য করে।
- একটি গতিশীল পজিশন ম্যানেজমেন্ট সিস্টেম তৈরি করুন যা বাজারের অবস্থার উপর নির্ভর করে স্বয়ংক্রিয়ভাবে লেনদেনের আকারকে সামঞ্জস্য করে।
- ট্রেডিং সিদ্ধান্তের সঠিকতা বাড়ানোর জন্য মৌলিক বিশ্লেষণ মডিউলগুলিকে একত্রিত করা।
সারসংক্ষেপ
এটি একটি যুক্তিসঙ্গত, যুক্তিসঙ্গত এবং সুস্পষ্ট প্রবণতা ট্র্যাকিং সিস্টেম। দ্বি-স্তর সূচক মসৃণ প্রযুক্তি এবং একটি সম্পূর্ণ ঝুঁকি ব্যবস্থাপনা সিস্টেমের মাধ্যমে, কৌশলটি প্রবণতা বাজারে ভাল পারফরম্যান্স করতে পারে। তবে, ব্যবহারকারীদের তাদের ঝুঁকি বহনযোগ্যতার উপর ভিত্তি করে পজিশনের আকারটি সামঞ্জস্য করতে হবে, এবং রিয়েল-টাইম ট্রেডিংয়ের আগে পর্যাপ্ত ব্যাক-টেস্টিং যাচাইয়ের পরামর্শ দেওয়া হয়। প্রস্তাবিত অপ্টিমাইজেশন দিকনির্দেশের মাধ্যমে কৌশলটির আরও উন্নতির জায়গা রয়েছে।
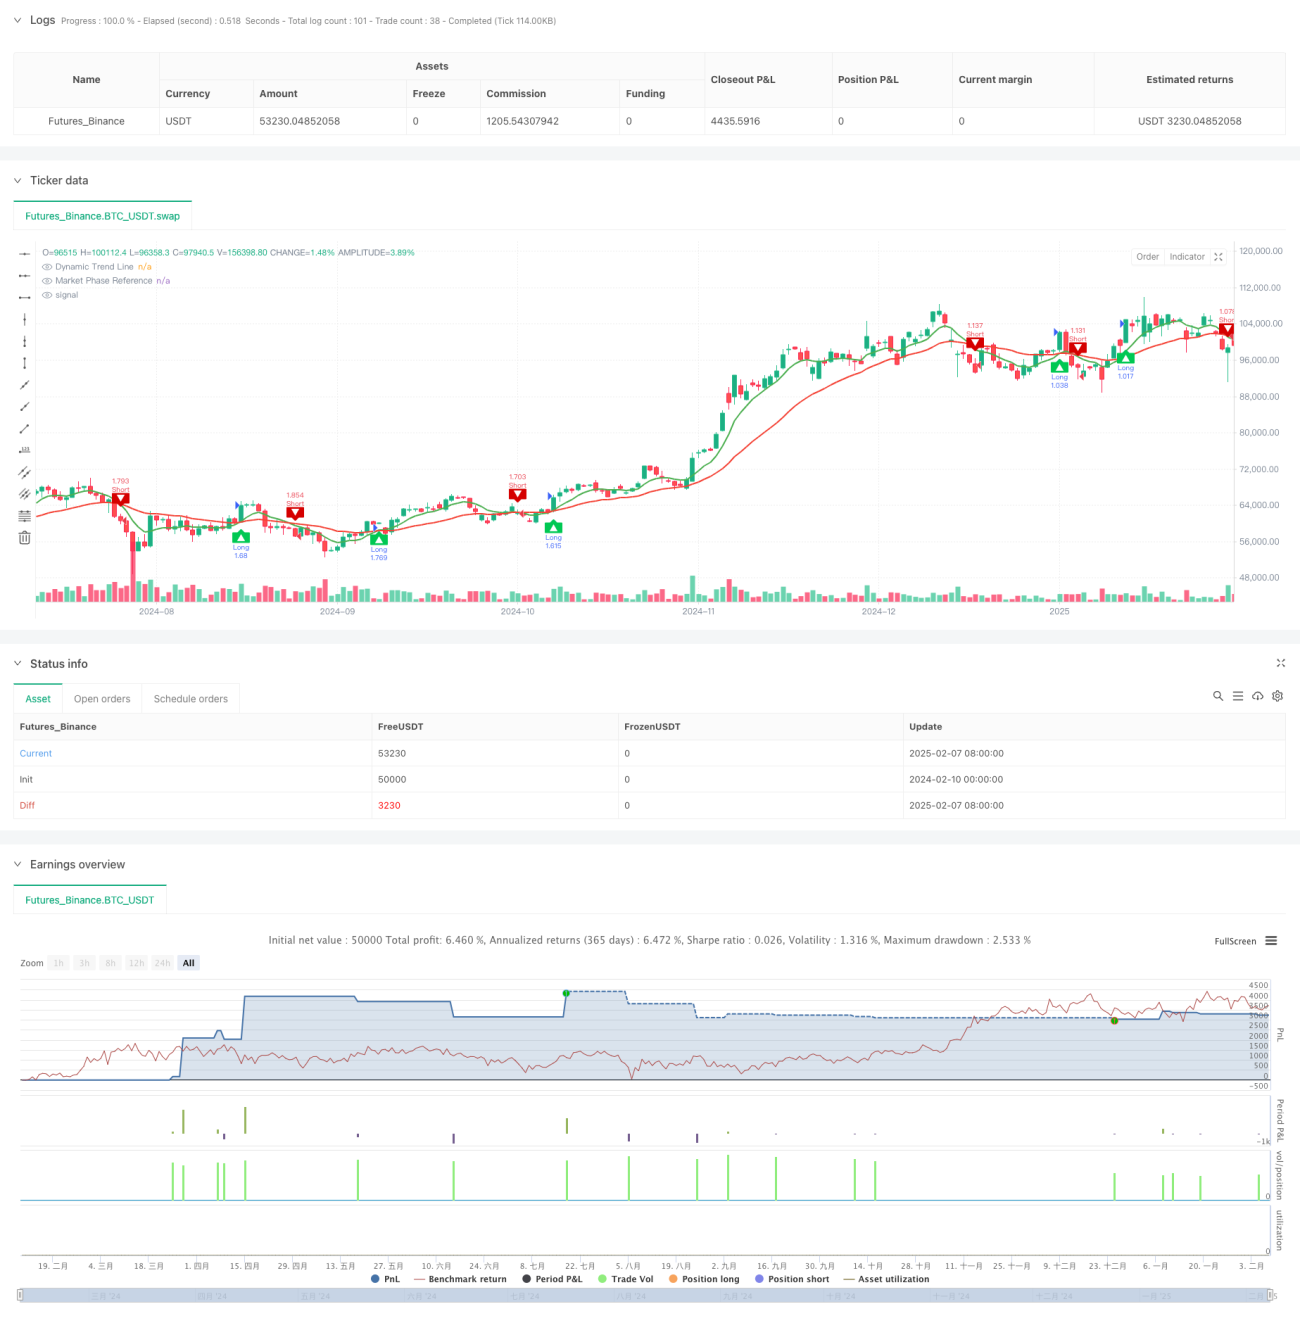
/*backtest
start: 2024-02-10 00:00:00
end: 2025-02-08 08:00:00
period: 1d
basePeriod: 1d
exchanges: [{"eid":"Futures_Binance","currency":"BTC_USDT"}]
*/

//@version=5
strategy("Dynamic Trend Navigator AI [CodingView]", overlay=true, initial_capital=100000, default_qty_type=strategy.percent_of_equity , default_qty_value=200 )
- 1