ট্রেন্ড মোমেন্টাম স্ট্র্যাটেজি - জিগজ্যাগ মাল্টি-পিরিয়ড ডায়নামিক ব্যান্ড টাইমিং সিস্টেম

ওভারভিউ
এই কৌশলটি একটি মাল্টি-ডিমেনশনাল ট্রেডিং সিস্টেম যা জিগজ্যাগ এবং উইলিয়ামসকে একত্রিত করে। এই কৌশলটি গুরুত্বপূর্ণ ব্যাপ্তি উচ্চতা এবং নিম্নতা সনাক্ত করে এবং উইলিয়ামসকে ব্যবহার করে যখন বাজারটি ওভারবই বা ওভারসোল অবস্থায় পৌঁছে যায়। এই সংমিশ্রণটি কেবল বাজারের প্রধান প্রবণতা ঘুরিয়ে দেওয়ার পয়েন্টগুলিই ক্যাপচার করতে পারে না, তবে গতিশীলতা নিশ্চিতকরণের মাধ্যমে লেনদেনের নির্ভুলতা বাড়িয়ে তুলতে পারে।
কৌশল নীতি
এই কৌশলটির মূল যুক্তি দুটি প্রধান উপাদান নিয়ে গঠিতঃ
- শব্দভিত্তিক সূচকটি একটি নির্দিষ্ট গভীরতা এবং বিচ্যুতি প্যারামিটারগুলির মাধ্যমে উল্লেখযোগ্য তরঙ্গের উচ্চ এবং নিম্ন চিহ্নিত করে, বাজার শব্দটি ফিল্টার করে এবং প্রবণতার দিকনির্দেশ নির্ধারণ করে। যখন একটি নতুন তরঙ্গের নিম্নতম গঠন হয় তখন একটি উত্থান প্রবণতা শুরু হয় এবং একটি নতুন তরঙ্গের উচ্চতর একটি পতন প্রবণতা শুরু হয়।
- উইলিয়াম সূচকটি বর্তমান মূল্যের সাথে একটি নির্দিষ্ট সময়ের মধ্যে সর্বোচ্চ মূল্যের তুলনা করে বাজারের গতিশীলতার অবস্থা গণনা করে। সূচকটির মান 80 টিরও বেশি হলে ওভারসোল্ড (সম্ভাব্য ক্রয় সুযোগ) এবং 20 টিরও বেশি হলে ওভারসোল্ড (সম্ভাব্য বিক্রয় সুযোগ) বোঝায়।
কৌশলগত লেনদেনের নিয়মাবলী নিম্নরূপঃ
- একাধিক শর্তাবলীঃ শব্দের আকারের সূচকটি নতুন ব্যাপ্তির নিম্নতম চিহ্নিত করে এবং উইলিয়াম সূচকটি ওভারসোল্ড অঞ্চল থেকে উপরে উঠে যায়
- শূন্যতা শর্তঃ শব্দের আকৃতির সূচকটি নতুন ব্যাপ্তির উচ্চতা চিহ্নিত করে এবং উইলিয়াম সূচকটি ওভারবয় অঞ্চল থেকে নীচে ভেঙে যায়
- স্টপ লস ১% এবং স্টপ স্টপ ২%
কৌশলগত সুবিধা
- মাল্টি-ডাইমেনশনাল নিশ্চিতকরণঃ ট্রেডিং সিগন্যালের নির্ভরযোগ্যতা বাড়ানোর জন্য প্রবণতা এবং গতিশীলতার দ্বৈত নিশ্চিতকরণ
- স্বনির্ধারণযোগ্যতাঃ শব্দের আকৃতির সূচকের বিচ্যুতি প্যারামিটারগুলি বাজারের ওঠানামার গতিশীলতার সাথে সামঞ্জস্য করতে পারে
- ঝুঁকি নিয়ন্ত্রণে দক্ষতাঃ প্রতি লেনদেনের ঝুঁকি নিয়ন্ত্রণের জন্য নির্দিষ্ট শতাংশে স্টপ-অফ-লস কৌশল ব্যবহার করুন
- ভাল ভিজ্যুয়ালাইজেশনঃ ট্রেডিং সিগন্যালগুলি ট্যাগ এবং গ্রাফিক্সের মাধ্যমে বিশ্লেষণ এবং অপ্টিমাইজেশনের জন্য পরিষ্কারভাবে প্রদর্শিত হয়
কৌশলগত ঝুঁকি
- বাজারের ঝুঁকিঃ ঘন ঘন মিথ্যা ব্রেকিং সিগন্যাল হতে পারে
- স্লাইড পয়েন্টের ঝুঁকিঃ দ্রুত গতিতে বড় স্লাইড পয়েন্ট হতে পারে
- প্যারামিটার সংবেদনশীলতাঃ নির্দেশক প্যারামিটার নির্বাচন কৌশল কর্মক্ষমতা উপর একটি বড় প্রভাব
- সিগন্যাল লেগারসিটিঃ নতুন ব্যান্ড পয়েন্ট গঠনের বিষয়টি নিশ্চিত করার জন্য কিছু দ্রুত ঘটনা মিস করা হতে পারে
কৌশল অপ্টিমাইজেশনের দিকনির্দেশনা
- বাজার পরিবেশ ফিল্টার যুক্ত করুনঃ বাজারের অবস্থা সনাক্ত করতে ওঠানামা সূচক যুক্ত করা যেতে পারে, বিভিন্ন পরিবেশে বিভিন্ন প্যারামিটার সেটিংস ব্যবহার করা যেতে পারে
- গতিশীল স্টপ অপ্টিমাইজেশানঃ এটিআর বা ওঠানামার হারের উপর ভিত্তি করে গতিশীলভাবে স্টপ পজিশনের সমন্বয় করতে পারে
- লেনদেনের পরিমাণ নিশ্চিতকরণঃ সংকেত তৈরির সময় লেনদেনের পরিমাণ যাচাইকরণ যুক্ত করুন
- সময় ফিল্টারঃ ট্রেডিংয়ের সময়কালের ফিল্টার যুক্ত করা যায়, যাতে বড় ধরনের ওঠানামার সময় ট্রেড করা যায় না
সারসংক্ষেপ
এটি একটি সম্পূর্ণ ট্রেডিং সিস্টেম যা প্রবণতা ট্র্যাকিং এবং গতিশীল ট্রেডিংয়ের সমন্বয় করে। একাধিক প্রযুক্তিগত সূচকগুলির সমন্বয়মূলক কার্যকারিতার মাধ্যমে, উচ্চতর হার বজায় রাখার সময় কার্যকরভাবে ঝুঁকি নিয়ন্ত্রণ করা যায়। যদিও কিছুটা পিছিয়ে থাকা সত্ত্বেও, যুক্তিসঙ্গত প্যারামিটার অপ্টিমাইজেশন এবং ঝুঁকি পরিচালনার মাধ্যমে স্থিতিশীল ট্রেডিং কার্যকারিতা অর্জন করা যায়। এই কৌশলটি মাঝারি এবং দীর্ঘমেয়াদী প্রবণতার জন্য বিশেষভাবে উপযুক্ত, যখন বাজারে সুস্পষ্ট দিকনির্দেশের সুযোগ উপস্থিত হয় তখন আরও ভাল কাজ করে।
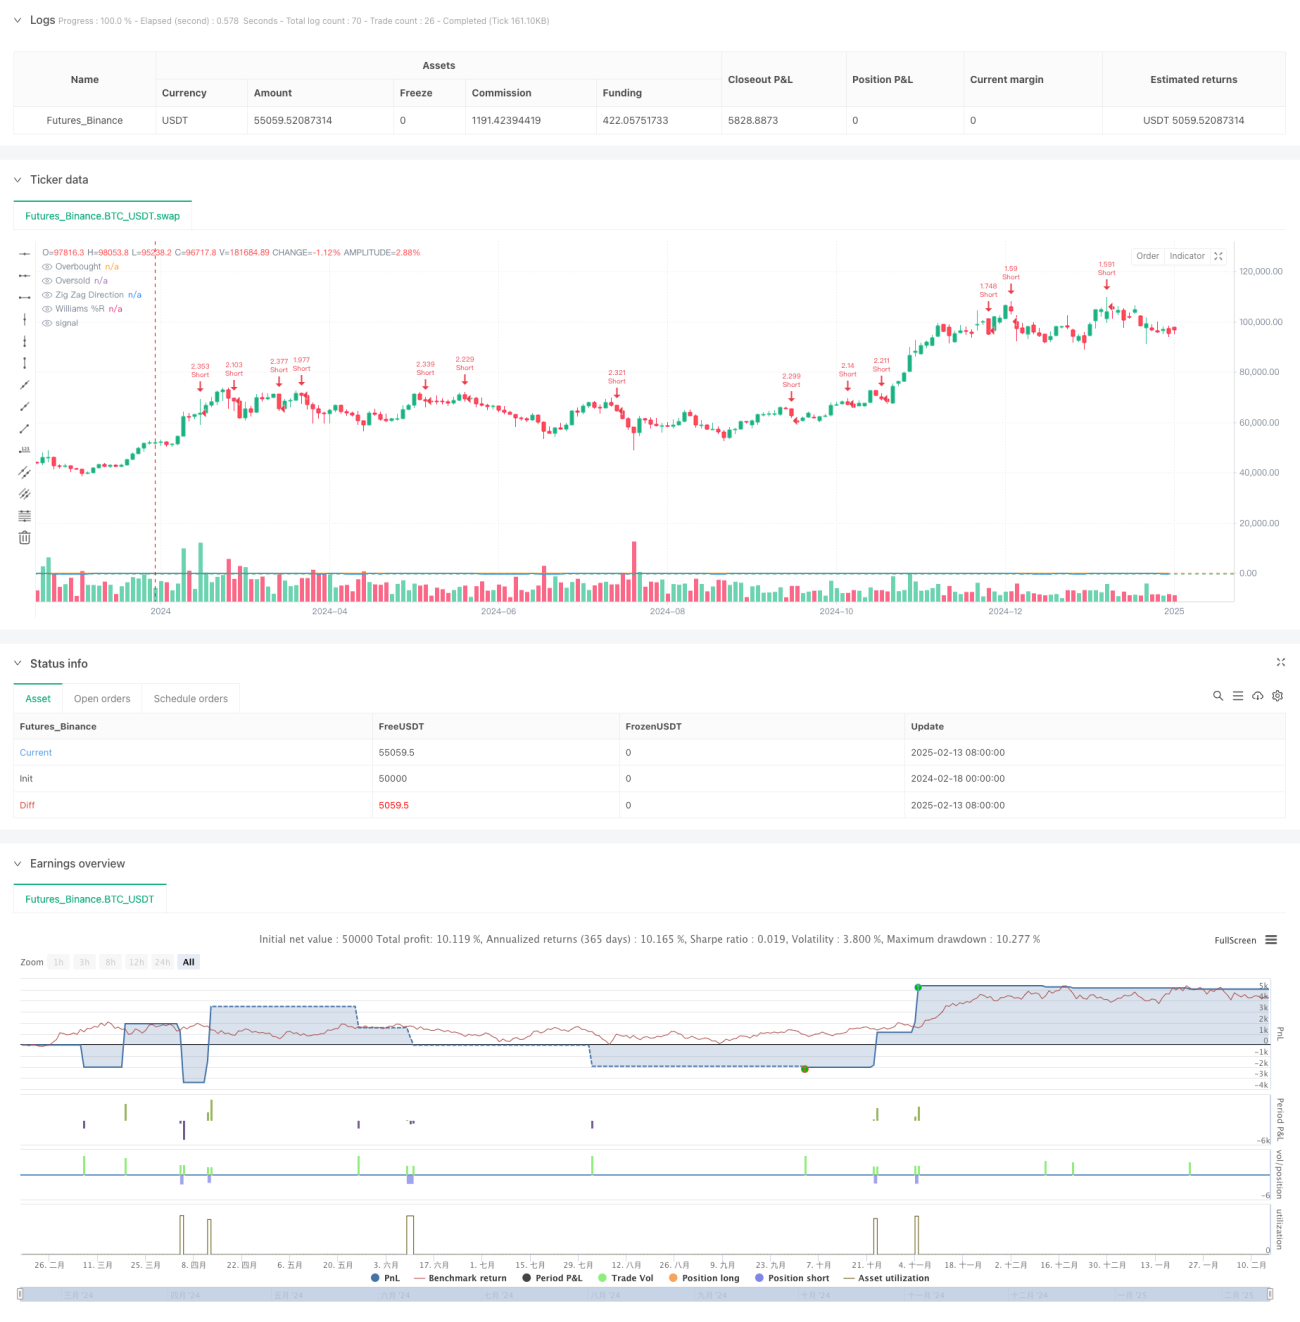
/*backtest
start: 2024-02-18 00:00:00
end: 2025-02-15 08:00:00
period: 2d
basePeriod: 2d
exchanges: [{"eid":"Futures_Binance","currency":"BTC_USDT"}]
*/

//@version=6
strategy("Zig Zag + Williams %R Strategy", overlay=true, default_qty_type=strategy.percent_of_equity, default_qty_value=300)

// ====================- 1