
সারসংক্ষেপ
এই কৌশলটি একটি উন্নত রিলেটিভ স্ট্রেংথ ইনডেক্স (RSI) ভিত্তিক ট্রেন্ড ফলোয়িং ট্রেডিং সিস্টেম। এটি RSI-এর একটি উন্নত সংস্করণ গণনা করে এবং এর সিগন্যাল লাইনের সাথে মিলিয়ে বিভিন্ন বাজার চক্রে ট্রেন্ড রিভার্সালের সুযোগ ধরে। কৌশলটি শুধু ইনডিকেটরের মান গণনা করে না, বরং দৃশ্যমান ওভারবট/ওভারসোল্ড এলাকা দেখিয়ে বাজারের অবস্থা বুঝতে সাহায্য করে।
কৌশলের নীতি
কৌশলের মূল নীতি হলো উন্নত RSI (ARSI) গণনার মাধ্যমে বাজারের প্রবণতা চিহ্নিত করা। এর মধ্যে রয়েছে:
- নির্দিষ্ট সময়ের মধ্যে সর্বোচ্চ ও সর্বনিম্ন মূল্য গণনা করে মূল্যের পরিসর নির্ণয়
- মূল্য পরিবর্তনের ভিত্তিতে পার্থক্য গণনা
- ঐচ্ছিক মুভিং এভারেজ পদ্ধতি (EMA, SMA, RMA, TMA) ব্যবহার করে পার্থক্যকে স্মুথ করা
- ফলাফলকে ০-১০০ পরিসরে স্বাভাবিকীকরণ করা
- যখন ARSI ৫০-এর নিচে সিগন্যাল লাইন অতিক্রম করে, তখন লং সিগন্যাল তৈরি হয়
- যখন ARSI ৫০-এর উপরে সিগন্যাল লাইন ভেঙে নিচে যায়, তখন শর্ট সিগন্যাল তৈরি হয়
কৌশলের সুবিধা
- সিগন্যাল নিশ্চিতকরণ প্রক্রিয়া উন্নত – ARSI ও সিগন্যাল লাইনের ক্রস এবং সেন্টারলাইন ফিল্টারের মাধ্যমে সিগন্যালের নির্ভরযোগ্যতা নিশ্চিত করা হয়
- অভিযোজন ক্ষমতা – বিভিন্ন মুভিং এভারেজ পদ্ধতি সমর্থন করে, যা বাজারের বৈশিষ্ট্য অনুযায়ী সামঞ্জস্য করা যায়
- যুক্তিসঙ্গত ঝুঁকি ব্যবস্থাপনা – পজিশনের শতাংশের ভিত্তিতে ব্যবস্থাপনা করে প্রতিটি ট্রেডের ঝুঁকি কার্যকরভাবে নিয়ন্ত্রণ করা যায়
- চমৎকার ভিজুয়ালাইজেশন – রঙিন ফিলিংয়ের মাধ্যমে ওভারবট/ওভারসোল্ড এলাকা স্পষ্টভাবে দেখানো হয়, দ্রুত মূল্যায়নে সাহায্য করে
- রিভার্স পজিশন ম্যানেজমেন্ট – বিপরীত সিগন্যাল এলে স্বয়ংক্রিয়ভাবে বিদ্যমান পজিশন বন্ধ করে, দ্বিমুখী পজিশনের ঝুঁকি এড়ানো যায়
কৌশলের ঝুঁকি
- সাইডওয়ে বাজারে ঝুঁকি – রেঞ্জবাউন্ড বাজারে ঘন ঘন ভুয়া সিগন্যাল তৈরি হতে পারে
- ল্যাগ ঝুঁকি – মুভিং এভারেজ ব্যবহারের কারণে সিগন্যালে কিছুটা বিলম্ব হয়
- প্যারামিটার সংবেদনশীলতা – ভিন্ন প্যারামিটার সেটিংসে কৌশলের পারফরম্যান্সে বড় পার্থক্য দেখা দিতে পারে
- বাজার অভিযোজন ঝুঁকি – বিভিন্ন বাজার পরিবেশে কৌশলের কার্যকারিতা উল্লেখযোগ্যভাবে ভিন্ন হতে পারে
- মূলধন ব্যবস্থাপনা ঝুঁকি – স্থির শতাংশভিত্তিক পজিশন সাইজ অস্থির বাজারে বড় ঝুঁকি সৃষ্টি করতে পারে
কৌশলের উন্নয়নের দিকনির্দেশ
- অস্থিরতা ফিল্টার যোগ করা – কম অস্থিরতার পরিবেশে ট্রেড সিগন্যাল ফিল্টার করতে ATR ইনডিকেটর যোগ করা যেতে পারে
- ট্রেন্ড নিশ্চিতকরণ ইনডিকেটর বৃদ্ধি – দীর্ঘ সময়ের ট্রেন্ড ইনডিকেটর যুক্ত করে সিগন্যালের নির্ভরযোগ্যতা বাড়ানো যায়
- পজিশন ম্যানেজমেন্ট অপ্টিমাইজ – বাজারের অস্থিরতা অনুযায়ী পজিশনের অনুপাত গতিশীলভাবে সামঞ্জস্য করা
- স্টপ-লস মেকানিজম যোগ – ATR ভিত্তিক গতিশীল স্টপ-লস যুক্ত করে ঝুঁকি নিয়ন্ত্রণ আরও উন্নত করা
- অভিযোজিত প্যারামিটার তৈরি – প্যারামিটারের গতিশীল অপ্টিমাইজেশন পদ্ধতি নিয়ে গবেষণা করে কৌশলের অভিযোজন ক্ষমতা বাড়ানো
উপসংহার
এটি একটি সম্পূর্ণ গঠন, যুক্তিসঙ্গত ও পরিষ্কার ট্রেন্ড ফলোয়িং কৌশল। উন্নত RSI-এর উদ্ভাবনী গণনা পদ্ধতি এবং একাধিক টেকনিক্যাল ইনডিকেটরের সুবিধা সমন্বয় করে একটি নির্ভরযোগ্য ট্রেডিং সিস্টেম তৈরি হয়েছে। কিছু সহজাত ঝুঁকি থাকলেও, যুক্তিসঙ্গত অপ্টিমাইজেশন ও ঝুঁকি ব্যবস্থাপনার মাধ্যমে এই কৌশলটি বাস্তব বাণিজ্যে ভালো সম্ভাবনা রাখে। ট্রেডারদের বাস্তব ব্যবহারের আগে প্যারামিটার সেটিংস পুঙ্খানুপুঙ্খভাবে পরীক্ষা করার এবং বাজার পরিবেশ অনুযায়ী কৌশল সামঞ্জস্য করার পরামর্শ দেওয়া হচ্ছে।
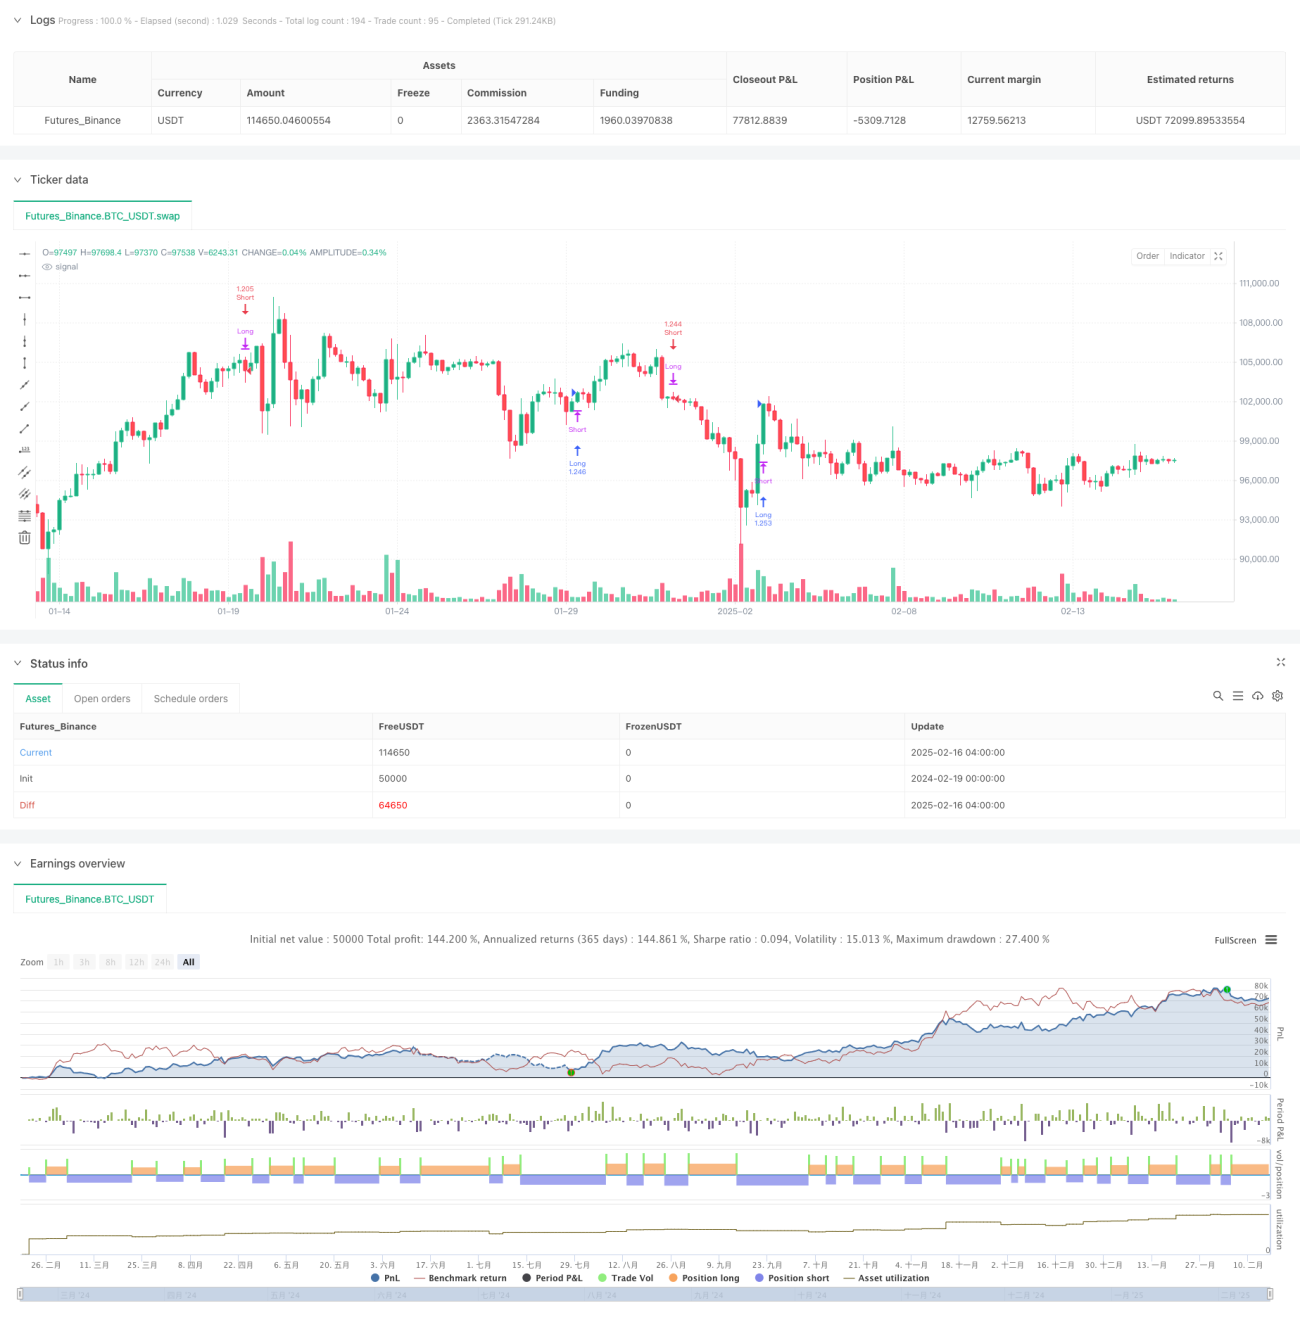
/*backtest
start: 2024-02-19 00:00:00
end: 2025-02-16 08:00:00
period: 4h
basePeriod: 4h
exchanges: [{"eid":"Futures_Binance","currency":"BTC_USDT"}]
*/

//@version=6
strategy("Ultimate RSI [LuxAlgo] Strategy", shorttitle="ULT RSI Strat", overlay=false, initial_capital=10000, currency=currency.USD, default_qty_type=strategy.percent_of_equity, default_qty_value=100)

//------------------------------------------------------------------------------- 1