
ওভারভিউ
এই কৌশলটি হল একটি পিভট পয়েন্টের উপর ভিত্তি করে গড় মূল্যের রিটার্ন ট্রেডিং সিস্টেম। এটি সাপ্তাহিক সমর্থন (S1-S4) এবং প্রতিরোধ (R1-R4) গণনা করে ট্রেডিং প্রবেশ এবং প্রস্থান নির্ধারণ করে। কৌশলটি ধাপে ধাপে পজিশনিং পদ্ধতি গ্রহণ করে, বিভিন্ন সমর্থন পয়েন্টের মধ্যে একাধিক ক্রয় করে এবং প্রতিরোধের সাথে সাথে মুনাফা অর্জন করে। এই পদ্ধতিটি বাজারের অস্থিরতার বৈশিষ্ট্যগুলিকে পুরোপুরি ব্যবহার করে, যা হিজড়া বাজারে ভাল কাজ করে।
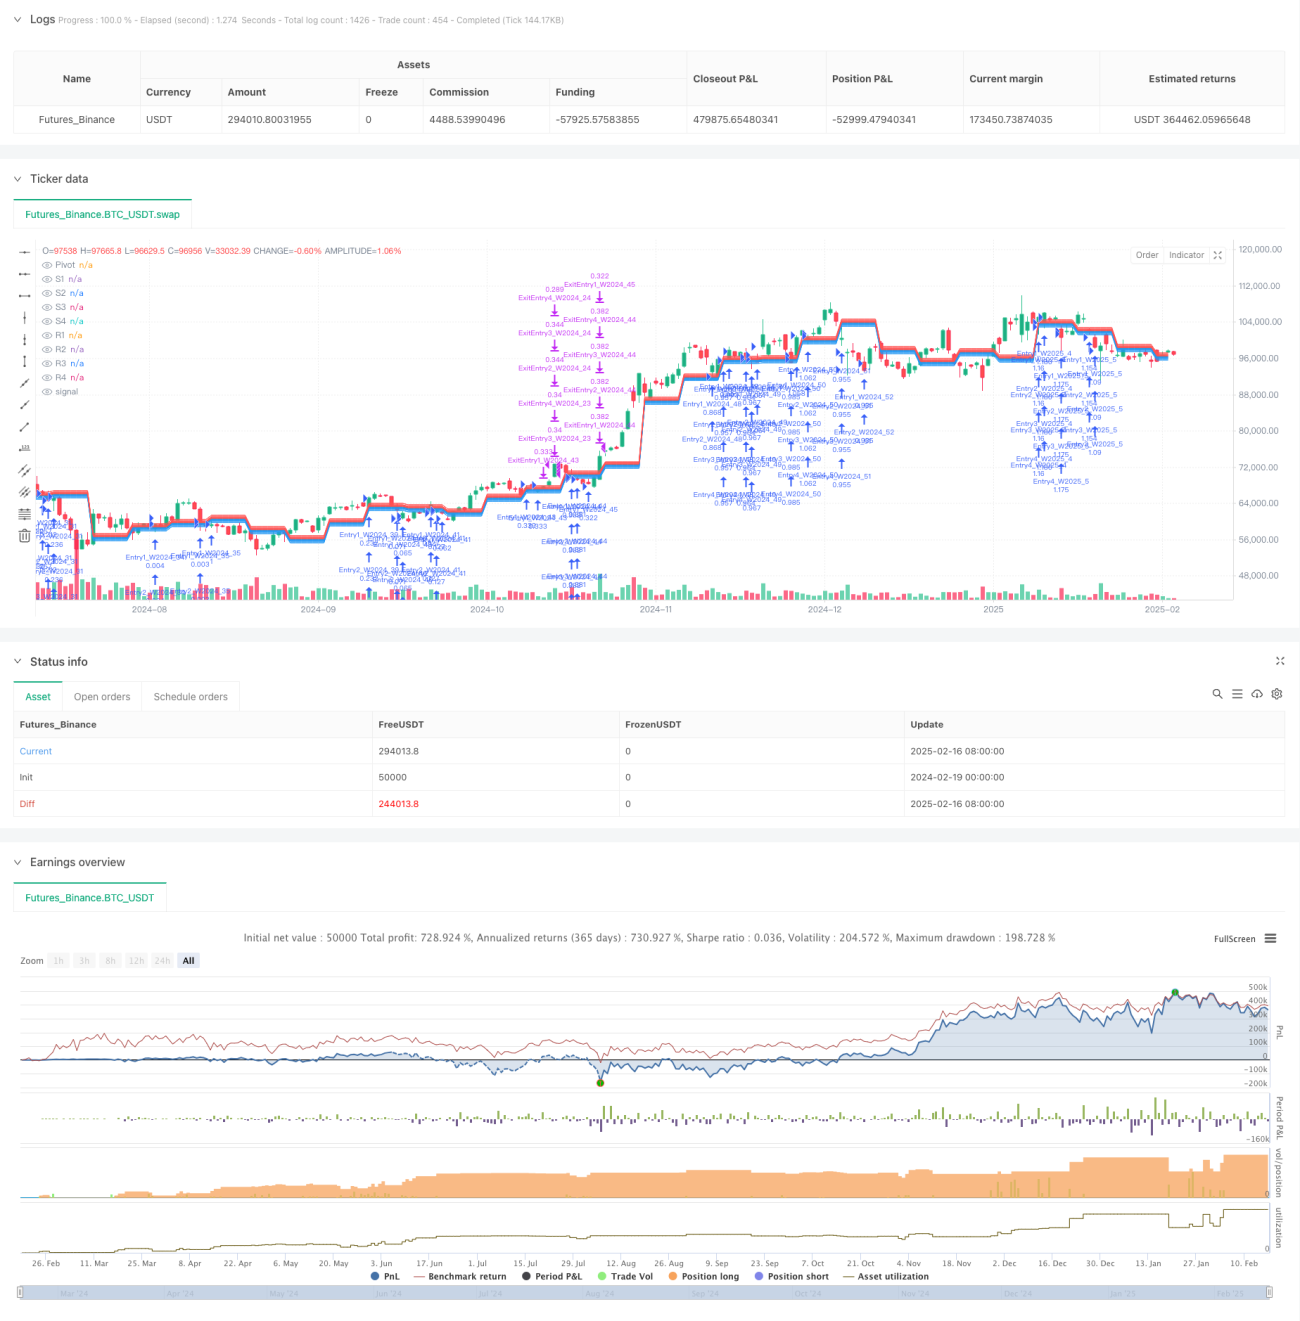
কৌশল নীতি
কৌশলটির মূল অংশটি হ'ল পূর্ববর্তী সপ্তাহের সর্বোচ্চ, সর্বনিম্ন এবং বন্ধের দামের মাধ্যমে এই সপ্তাহের মূল পয়েন্টগুলি গণনা করা, তারপরে একাধিক সমর্থন এবং প্রতিরোধের স্থানগুলি নির্ধারণ করা, যা পূর্ববর্তী পয়েন্টের দূরত্বের উপর ভিত্তি করে। যখন দাম সমর্থন স্পর্শ করে তখন ক্রয় করা হয় এবং প্রাসঙ্গিক প্রতিরোধের স্থানগুলিতে মুনাফা অর্জনের লক্ষ্য নির্ধারণ করা হয়।
মূল অক্ষ = (গত সপ্তাহের সর্বোচ্চ মূল্য + গত সপ্তাহের সর্বনিম্ন মূল্য + গত সপ্তাহের শেষ মূল্য) / 3
কৌশলটি একই সাথে সর্বাধিক 4 টি পজিশন ধারণ করার অনুমতি দেয়, প্রতিটি পজিশন বিভিন্ন সমর্থন এবং প্রতিরোধের সাথে সম্পর্কিত। সমস্ত পজিশন প্রতি সপ্তাহের শুরুতে নতুন লেনদেনের স্তর পুনরায় গণনা করে। এই নকশাটি লেনদেনের ধারাবাহিকতা নিশ্চিত করে এবং বাজারের পরিবর্তনের সাথে খাপ খাইয়ে নেয়।
কৌশলগত সুবিধা
- লেনদেনের যুক্তি স্পষ্ট, বোঝা এবং কার্যকর করা সহজ
- একক লেনদেনের ঝুঁকি হ্রাস করার জন্য ধাপে ধাপে আমানত স্থাপন
- ঘূর্ণিপথের স্তরের প্রতিরোধের স্তর ব্যবহার করে, দিনের মধ্যে শব্দ প্রভাব হ্রাস করে
- বিভিন্ন বাজারের বৈশিষ্ট্য অনুযায়ী কৌশলটি প্যারামিটারগুলিকে নমনীয়ভাবে সামঞ্জস্য করতে পারে
- ঝুঁকি নিয়ন্ত্রণের জন্য শতকরা পজিশনের পরিমাণ
- ট্রেডিংয়ে লাভের জন্য পর্যাপ্ত জায়গা দেওয়ার জন্য সময় নেই।
কৌশলগত ঝুঁকি
- কোন স্টপ সেট নেই, শক্তিশালী ট্রেন্ডিং মার্কেটে বৃহত্তর প্রত্যাহার হতে পারে
- একাধিক পজিশনে বেশি অর্থ ব্যয় হতে পারে
- বাজারের উচ্চ অস্থিরতার মধ্যে ভুল সংকেত দেখা দিতে পারে
- ভুলভাবে বেস সেট করা হলে, অযৌক্তিক অবস্থানে গর্ত তৈরি হতে পারে।
ঝুঁকি কমানোর জন্য, ট্রেন্ড ফিল্টার যোগ করার পরামর্শ দেওয়া হয়, শুধুমাত্র একটি উত্থান প্রবণতা মধ্যে পজিশন খোলার; এটিআর ভিত্তিক গতিশীল স্টপ লস সেট করা যেতে পারে।
কৌশল অপ্টিমাইজেশনের দিকনির্দেশনা
- ট্রানজিট নিশ্চিতকরণ ব্যবস্থা এবং প্রবেশের সংকেতের নির্ভরযোগ্যতা বৃদ্ধি
- আরএসআই এবং অন্যান্য প্রযুক্তিগত সূচকগুলিকে ওভার-বই ওভার-সোল্ড ফিল্টার করার জন্য প্রবর্তন করা
- ভুয়া সংকেত হ্রাস করার জন্য মাল্টি টাইম সাইকেল কনফার্মেশন মেকানিজম বিকাশ
- পজিশন ম্যানেজমেন্ট সিস্টেম অপ্টিমাইজ করুন, বাজারের গতিশীলতা অনুসারে পজিশনের সংখ্যা সামঞ্জস্য করুন
- প্রাসঙ্গিকতা বিশ্লেষণ যুক্ত করুন, উচ্চ প্রাসঙ্গিক বাজারে একই সময়ে পজিশন তৈরি করা এড়িয়ে চলুন
সারসংক্ষেপ
এটি একটি ক্লাসিক টেকনিক্যাল অ্যানালিসিস থিওরির উপর ভিত্তি করে গড় মানের রিটার্ন কৌশল, যা প্রতিরোধের স্থানের সাথে ঘূর্ণনপথকে সমর্থন করে এবং ট্রেডিংয়ের সুযোগকে ক্যাপচার করে। কৌশলটি সহজ এবং নমনীয়ভাবে ডিজাইন করা হয়েছে, যা উচ্চতর ওঠানামাযুক্ত বাজারে প্রয়োগের জন্য উপযুক্ত। যুক্তিসঙ্গত প্যারামিটার অপ্টিমাইজেশন এবং ঝুঁকি পরিচালনার মাধ্যমে, কৌশলটি বিভিন্ন বাজার পরিবেশে স্থিতিশীল পারফরম্যান্স বজায় রাখতে সক্ষম। ব্যবসায়ীরা তাদের প্যারামিটার সেটিংটি ব্যবহারের আগে পুরোপুরি পরীক্ষা করার পরামর্শ দেয় এবং নির্দিষ্ট বাজারের বৈশিষ্ট্য অনুসারে যথাযথভাবে সামঞ্জস্য করে।
- 1