
এই কৌশলটি একটি সমন্বিত ট্রেডিং সিস্টেম যা ফিবোনাচি রিটার্নের স্তর, চলমান গড়ের ক্রস এবং গতিশীল প্রবণতার বিচারকে একত্রিত করে। এটি দ্রুত চলমান গড় এবং ধীর চলমান গড়ের ক্রস দ্বারা লেনদেনের সংকেত তৈরি করে এবং ফিবোনাচি রিটার্নের স্তরকে গুরুত্বপূর্ণ মূল্য রেফারেন্স পয়েন্ট হিসাবে ব্যবহার করে এবং ট্রেডিংয়ের সময়কে অনুকূলিত করার জন্য প্রবণতার বিচারকে একত্রিত করে। সিস্টেমটি ঝুঁকি পরিচালনার জন্য শতাংশ স্টপ লস এবং স্টপ সেটিংও অন্তর্ভুক্ত করে।
কৌশলটির মূল যুক্তি নিম্নলিখিত মূল উপাদানগুলির উপর ভিত্তি করে:
এটি একটি সমন্বিত ট্রেডিং কৌশল যা বেশ কয়েকটি ক্লাসিক প্রযুক্তিগত বিশ্লেষণ সরঞ্জামকে একত্রিত করে। চলমান গড়, ফিবোনাচিস রিট্র্যাক্ট এবং ট্রেন্ড বিশ্লেষণের সংমিশ্রণের মাধ্যমে, কৌশলটি বাজারে সম্ভাব্য ব্যবসায়ের সুযোগগুলি ধরতে সক্ষম। একই সাথে, একটি উন্নত ঝুঁকি ব্যবস্থাপনা সিস্টেম এবং একটি পরিষ্কার ভিজ্যুয়াল ইন্টারফেস এটিকে আরও ভাল ব্যবহারিক করে তোলে। যদিও কিছু অন্তর্নিহিত ঝুঁকি রয়েছে, তবে ক্রমাগত অপ্টিমাইজেশন এবং উন্নতির মাধ্যমে কৌশলটি প্রকৃত ব্যবসায়ের ক্ষেত্রে আরও ভাল পারফরম্যান্সের সম্ভাবনা রয়েছে।
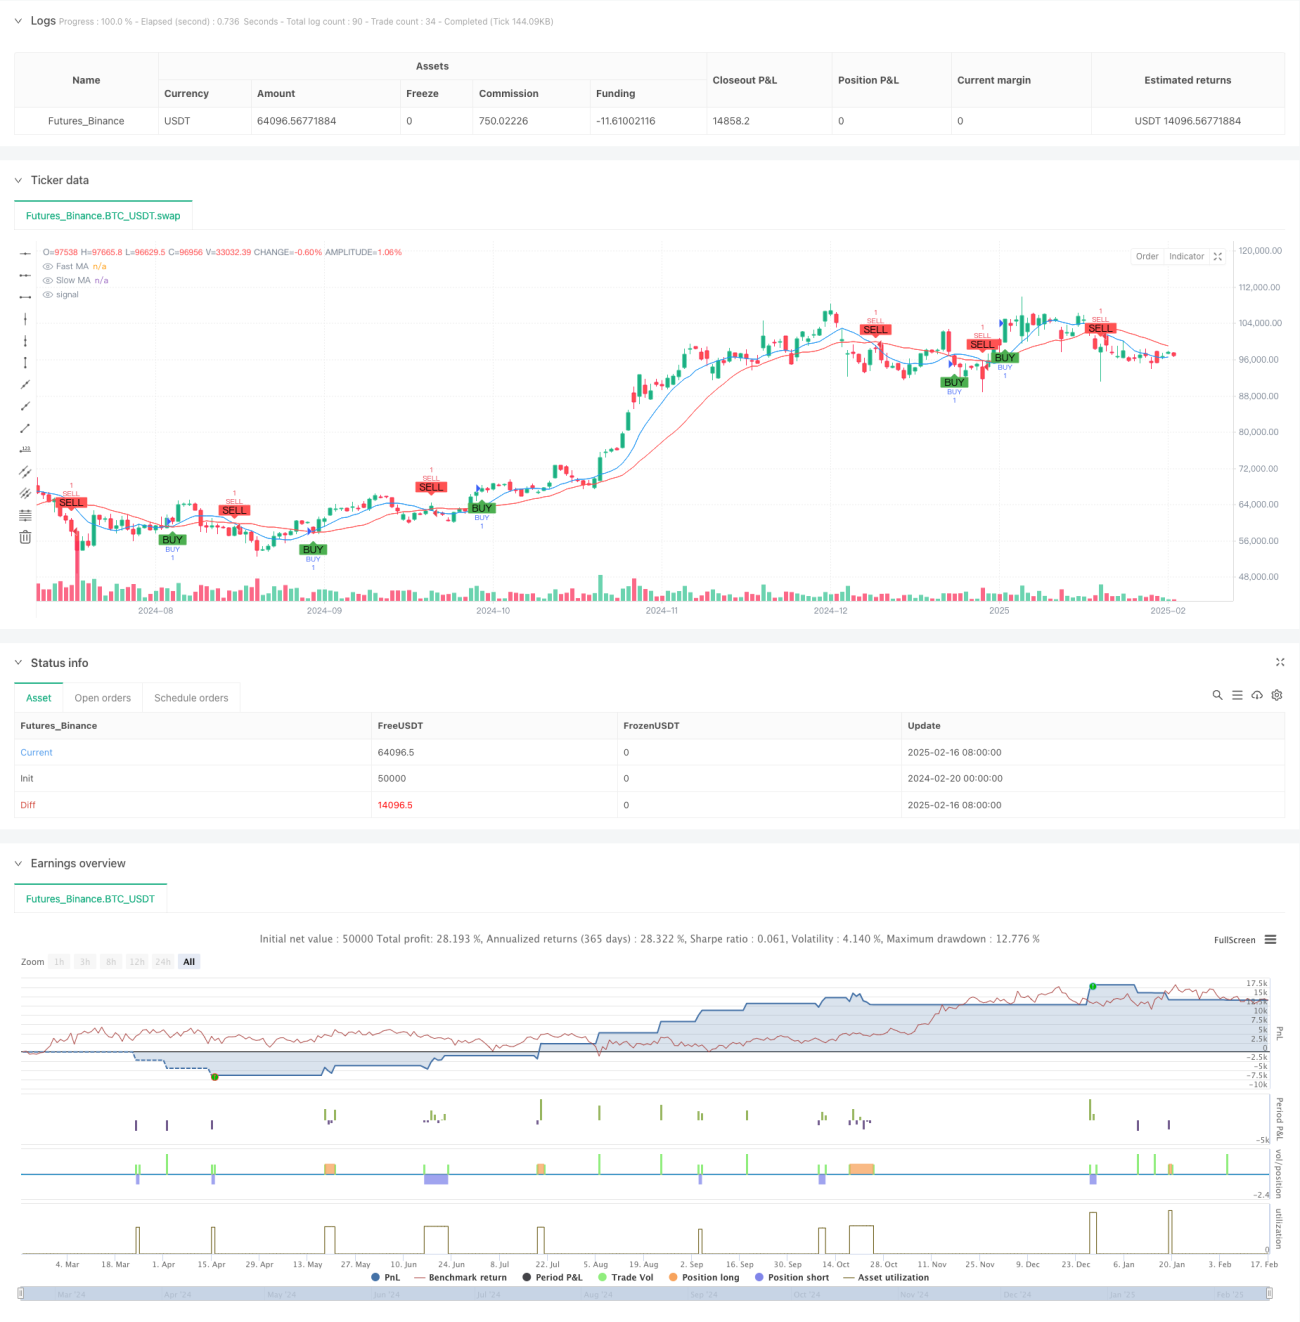
/*backtest
start: 2024-02-20 00:00:00
end: 2025-02-17 08:00:00
period: 1d
basePeriod: 1d
exchanges: [{"eid":"Futures_Binance","currency":"BTC_USDT"}]
*/
//@version=5
strategy("Buy/Sell Strategy with TP, SL, Fibonacci Levels, and Trend", overlay=true)
// Input for stop loss and take profit percentages
stopLossPercentage = input.int(2, title="Stop Loss (%)") // Stop loss percentage
takeProfitPercentage = input.int(4, title="Take Profit (%)") // Take profit percentage
// Example of a moving average crossover strategy
fastLength = input.int(9, title="Fast MA Length")
slowLength = input.int(21, title="Slow MA Length")
fastMA = ta.sma(close, fastLength)
slowMA = ta.sma(close, slowLength)
// Entry conditions (Buy when fast MA crosses above slow MA, Sell when fast MA crosses below slow MA)
longCondition = ta.crossover(fastMA, slowMA)
shortCondition = ta.crossunder(fastMA, slowMA)
// Plot moving averages for visual reference
plot(fastMA, color=color.blue, title="Fast MA")
plot(slowMA, color=color.red, title="Slow MA")
// Fibonacci Retracement Levels
lookback = input.int(100, title="Lookback Period for Fibonacci Levels")
highLevel = ta.highest(high, lookback)
lowLevel = ta.lowest(low, lookback)
fib236 = lowLevel + (highLevel - lowLevel) * 0.236
fib382 = lowLevel + (highLevel - lowLevel) * 0.382
fib50 = lowLevel + (highLevel - lowLevel) * 0.5
fib618 = lowLevel + (highLevel - lowLevel) * 0.618
// Display Fibonacci levels as text on the chart near price panel (left of candle)
label.new(bar_index, fib236, text="Fib 23.6%: " + str.tostring(fib236, "#.##"), style=label.style_label_left, color=color.purple, textcolor=color.white, size=size.small, xloc=xloc.bar_index, yloc=yloc.price)
label.new(bar_index, fib382, text="Fib 38.2%: " + str.tostring(fib382, "#.##"), style=label.style_label_left, color=color.blue, textcolor=color.white, size=size.small, xloc=xloc.bar_index, yloc=yloc.price)
label.new(bar_index, fib50, text="Fib 50%: " + str.tostring(fib50, "#.##"), style=label.style_label_left, color=color.green, textcolor=color.white, size=size.small, xloc=xloc.bar_index, yloc=yloc.price)
label.new(bar_index, fib618, text="Fib 61.8%: " + str.tostring(fib618, "#.##"), style=label.style_label_left, color=color.red, textcolor=color.white, size=size.small, xloc=xloc.bar_index, yloc=yloc.price)
// Trend condition: Price uptrend or downtrend
trendCondition = close > fastMA ? "Uptrending" : close < fastMA ? "Downtrending" : "Neutral"
// Remove previous trend label and add new trend label
var label trendLabel = na
if (not na(trendLabel))
label.delete(trendLabel)
// Create a new trend label based on the current trend
trendLabel := label.new(bar_index, close, text="Trend: " + trendCondition, style=label.style_label_left, color=color.blue, textcolor=color.white, size=size.small, xloc=xloc.bar_index, yloc=yloc.price)
// Buy and Sell orders with Stop Loss and Take Profit
if (longCondition)
// Set the Stop Loss and Take Profit levels based on entry price
stopLossLevel = close * (1 - stopLossPercentage / 100)
takeProfitLevel = close * (1 + takeProfitPercentage / 100)
// Enter long position with stop loss and take profit levels
strategy.entry("BUY", strategy.long)
strategy.exit("Sell", "BUY", stop=stopLossLevel, limit=takeProfitLevel)
// Display TP, SL, and Entry price labels on the chart near price panel (left of candle)
label.new(bar_index, takeProfitLevel, text="TP\n" + str.tostring(takeProfitLevel, "#.##"), style=label.style_label_left, color=color.green, textcolor=color.white, size=size.small, xloc=xloc.bar_index, yloc=yloc.price)
label.new(bar_index, stopLossLevel, text="SL\n" + str.tostring(stopLossLevel, "#.##"), style=label.style_label_left, color=color.red, textcolor=color.white, size=size.small, xloc=xloc.bar_index, yloc=yloc.price)
label.new(bar_index, close, text="BUY\n" + str.tostring(close, "#.##"), style=label.style_label_left, color=color.blue, textcolor=color.white, size=size.small, xloc=xloc.bar_index, yloc=yloc.price)
if (shortCondition)
// Set the Stop Loss and Take Profit levels based on entry price
stopLossLevel = close * (1 + stopLossPercentage / 100)
takeProfitLevel = close * (1 - takeProfitPercentage / 100)
// Enter short position with stop loss and take profit levels
strategy.entry("SELL", strategy.short)
strategy.exit("Cover", "SELL", stop=stopLossLevel, limit=takeProfitLevel)
// Display TP, SL, and Entry price labels on the chart near price panel (left of candle)
label.new(bar_index, takeProfitLevel, text="TP\n" + str.tostring(takeProfitLevel, "#.##"), style=label.style_label_left, color=color.green, textcolor=color.white, size=size.small, xloc=xloc.bar_index, yloc=yloc.price)
label.new(bar_index, stopLossLevel, text="SL\n" + str.tostring(stopLossLevel, "#.##"), style=label.style_label_left, color=color.red, textcolor=color.white, size=size.small, xloc=xloc.bar_index, yloc=yloc.price)
label.new(bar_index, close, text="SELL\n" + str.tostring(close, "#.##"), style=label.style_label_left, color=color.orange, textcolor=color.white, size=size.small, xloc=xloc.bar_index, yloc=yloc.price)
// Plot Buy/Sell labels on chart
plotshape(series=longCondition, title="BUY Signal", location=location.belowbar, color=color.green, style=shape.labelup, text="BUY")
plotshape(series=shortCondition, title="SELL Signal", location=location.abovebar, color=color.red, style=shape.labeldown, text="SELL")