
ওভারভিউ
এই কৌশলটি একটি ট্রেডিং সিস্টেম যা প্রবণতা অনুসরণ করে যা বুলিন ব্রেক এবং স্ট্রিং ফর্ম্যাটগুলির উপর ভিত্তি করে। কৌশলটি তিনটি ক্রমাগত বুলিন ব্রেকিং স্ট্রিং সনাক্ত করে এবং স্ট্রিং এন্ট্রিতে ক্লোজ-আপ মূল্যের সাথে সংযুক্ত করে ট্রেডিং সংকেত নির্ধারণ করে। সিস্টেমটি প্রতিটি লেনদেনের স্টপ এবং স্টপ পরিচালনার জন্য একটি নির্দিষ্ট 1: 1 ঝুঁকি-লাভের অনুপাত ব্যবহার করে।
কৌশল নীতি
কৌশলটির মূল যুক্তি নিম্নলিখিত মূল উপাদানগুলির উপর ভিত্তি করে:
- ২০-চক্রের ব্রিন ব্যান্ডকে প্রধান সূচক হিসেবে ব্যবহার করে, স্ট্যান্ডার্ড ডিফারেনশিয়ালের গুণফল ২.০
- একাধিক প্রবেশের শর্তঃ ক্রমাগত তিনটি কে লাইন বন্ধের দামটি ট্র্যাকের উপর ভেঙে গেছে, এবং এই তিনটি কে লাইন হল যমজ লাইন, এবং বন্ধের দামটি সত্তার উপরের অর্ধেক অংশে অবস্থিত
- খালি প্রবেশের শর্তঃ ক্রমাগত তিনটি কে লাইন বন্ধের দামটি ট্র্যাকের নীচে ভেঙে গেছে এবং এই তিনটি কে লাইনই শূন্য লাইন এবং বন্ধের দামটি সত্তার নীচের অর্ধেক অংশে অবস্থিত
- স্টপ ক্ষতি প্রথম সংকেত K লাইন এর সর্বোচ্চ মান সেট করুন
- স্টপ অবস্থান সেট করার তুলনায় 1:1 ঝুঁকি-লাভের অনুপাত
কৌশলগত সুবিধা
- একাধিক নিশ্চিতকরণ ব্যবস্থা ব্যবহার করে, ক্রমাগত তিনটি K-লাইন ব্রেকিংয়ের ফর্ম্যাট প্রয়োজনীয়তার মাধ্যমে ভুয়া ব্রেকিংয়ের ঝুঁকি কার্যকরভাবে হ্রাস করা হয়েছে
- K-লাইন সত্তার মধ্যে ক্লোজ-আপ মূল্যের অবস্থান নির্ধারণের সাথে মিলিত হয়ে প্রবণতা নিশ্চিতকরণের নির্ভরযোগ্যতা বাড়ায়
- স্থির ঝুঁকি-লাভের অনুপাত ব্যবহার করে পজিশন পরিচালনা করুন, যা ঝুঁকি নিয়ন্ত্রণে সহায়তা করে
- কৌশলটি যৌক্তিকভাবে পরিষ্কার এবং বোঝা এবং কার্যকর করা সহজ
- ট্রেডিং সিগন্যালগুলি চিহ্নিতকরণ ফাংশন দ্বারা দৃশ্যমানভাবে প্রদর্শিত হয়, যা বিশ্লেষণকে সহজতর করে
কৌশলগত ঝুঁকি
- অস্থির বাজারে ঘন ঘন মিথ্যা সংকেত দেখা দিতে পারে।
- স্থির ঝুঁকি-লাভের অনুপাত শক্তিশালী প্রবণতাকে পুরোপুরি ধরতে পারে না
- ক্রমাগত তিনটি 'কে' লাইনের কঠোরতা কিছু সম্ভাব্য সুযোগ হারাতে পারে
- স্টপ লস সেট করা হয় সিগন্যালের K-লাইনের সর্বোচ্চ মানের উপর, যেখানে স্টপ লস অবস্থানটি বড় ওভারল্যাপের সময় খুব বেশি দূরে থাকতে পারে
নিম্নলিখিত উপায়ে ঝুঁকি পরিচালনা করার পরামর্শ দেওয়া হচ্ছেঃ
- বাজারের চক্রান্তের সাথে সংযুক্ত ব্রিনের ব্যান্ড প্যারামিটার
- বাজারের গতিশীলতার উপর ভিত্তি করে ঝুঁকি-লাভের অনুপাত
- ট্রেন্ড নিশ্চিতকরণ সূচক যোগ করুন
- স্টপ লস পজিশন সেটিং পদ্ধতি অপ্টিমাইজ করুন
কৌশল অপ্টিমাইজেশনের দিকনির্দেশনা
- প্যারামিটার অপ্টিমাইজেশানঃ
- বিভিন্ন বাজারের গতিশীলতার উপর ভিত্তি করে বুলিন-ব্যান্ডের সময়কাল এবং স্ট্যান্ডার্ড ডিফারেনশিয়ালের গুণকগুলি সামঞ্জস্য করা যায়
- তিনটি K-লাইনগুলির প্রয়োজনীয়তাকে গতিশীল বিচারে রূপান্তরিত করার বিষয়টি বিবেচনা করুন
- সংকেত অপ্টিমাইজেশান:
- ট্রেন্ড কনফার্মেশন ইন্ডিকেটর যেমন ADX বা ট্রেন্ড লাইন
- ক্যাটাগরি নিশ্চিতকরণ ব্যবস্থা চালু
- একটি সহযোগী হিসাবে দোলন সূচক অন্তর্ভুক্ত করার কথা বিবেচনা করুন
- পজিশন ম্যানেজমেন্ট অপ্টিমাইজেশানঃ
- ডায়নামিক ঝুঁকি-লাভের অনুপাত সেটিং
- ফান্ড ম্যানেজমেন্ট মডিউল যোগ করুন
- ভাণ্ডার নির্মাণ ও শান্তিপূর্ণ ভাণ্ডার ব্যবস্থার কথা বিবেচনা করা
- স্টপ লস অপ্টিমাইজেশানঃ
- ট্র্যাকিং স্টপ লস সিস্টেম
- এটিআর-ভিত্তিক স্টপডোজ দূরত্ব
- সময় নষ্টের বিষয়টি বিবেচনা করুন
সারসংক্ষেপ
এটি একটি কাঠামোগত, যুক্তিসঙ্গতভাবে সুস্পষ্ট প্রবণতা ট্র্যাকিং কৌশল। বুলিন বন্ডের ব্রেকডাউন এবং থ্রিলার ফর্ম্যাটের একাধিক নিশ্চিতকরণ প্রক্রিয়া দ্বারা, মিথ্যা সংকেতের ঝুঁকি কার্যকরভাবে হ্রাস করা হয়েছে। স্থির ঝুঁকি-লাভের অনুপাত সেটিং ট্রেডিং পরিচালনা সহজ করে তোলে, তবে কৌশলটির নমনীয়তাও সীমাবদ্ধ করে। প্যারামিটার সেটিং অপ্টিমাইজ করা, নিশ্চিতকরণ সূচক যুক্ত করা, পজিশন পরিচালনার উন্নতি করা ইত্যাদির মাধ্যমে কৌশলটির এখনও অনেক উন্নতির জায়গা রয়েছে। সামগ্রিকভাবে, এটি একটি ব্যবহারিক মূল্যের মৌলিক কৌশলগত কাঠামো যা নির্দিষ্ট প্রয়োজন অনুসারে আরও উন্নত করা যেতে পারে।
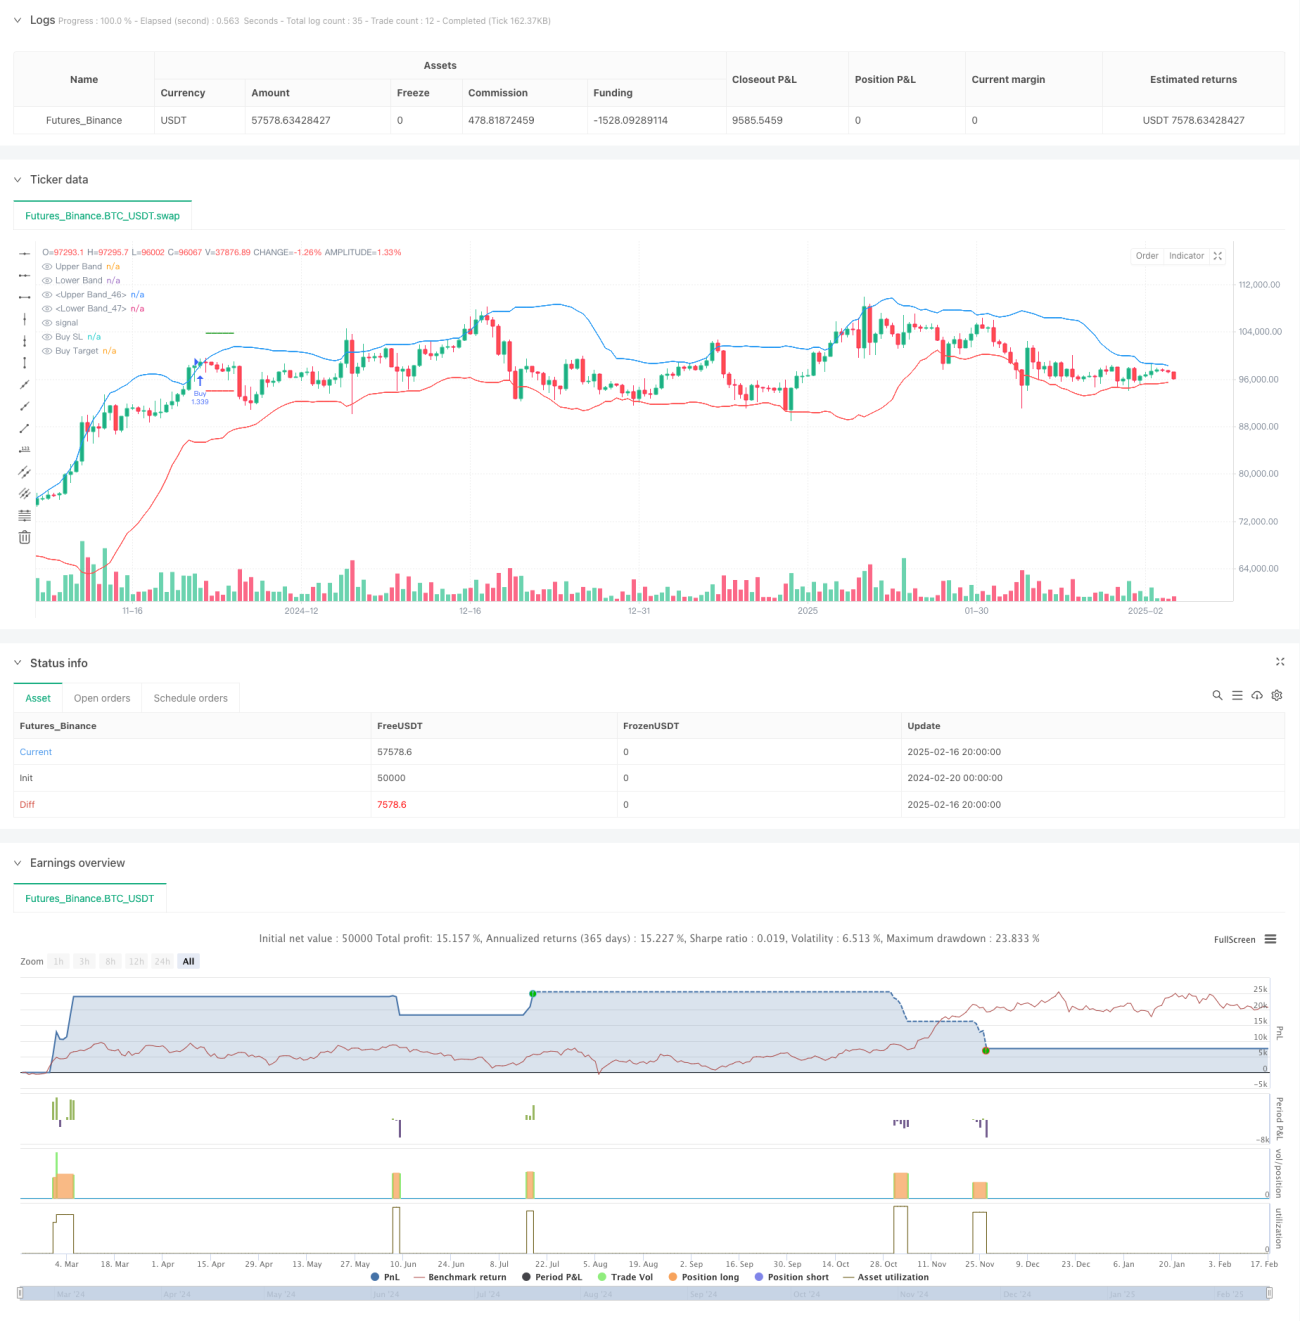
/*backtest
start: 2024-02-20 00:00:00
end: 2025-02-17 08:00:00
period: 12h
basePeriod: 12h
exchanges: [{"eid":"Futures_Binance","currency":"BTC_USDT"}]
*/

//@version=6
strategy("Bollinger Band Strategy (Close Near High/Low Relative to Half Range)", overlay=true, default_qty_type=strategy.percent_of_equity, default_qty_value=200, pyramiding=0)

// Bollinger Bands- 1