মাল্টি-ইন্ডিকেটর ট্রেন্ড ট্র্যাকিং উন্নত পরিমাণগত ট্রেডিং কৌশল

ওভারভিউ
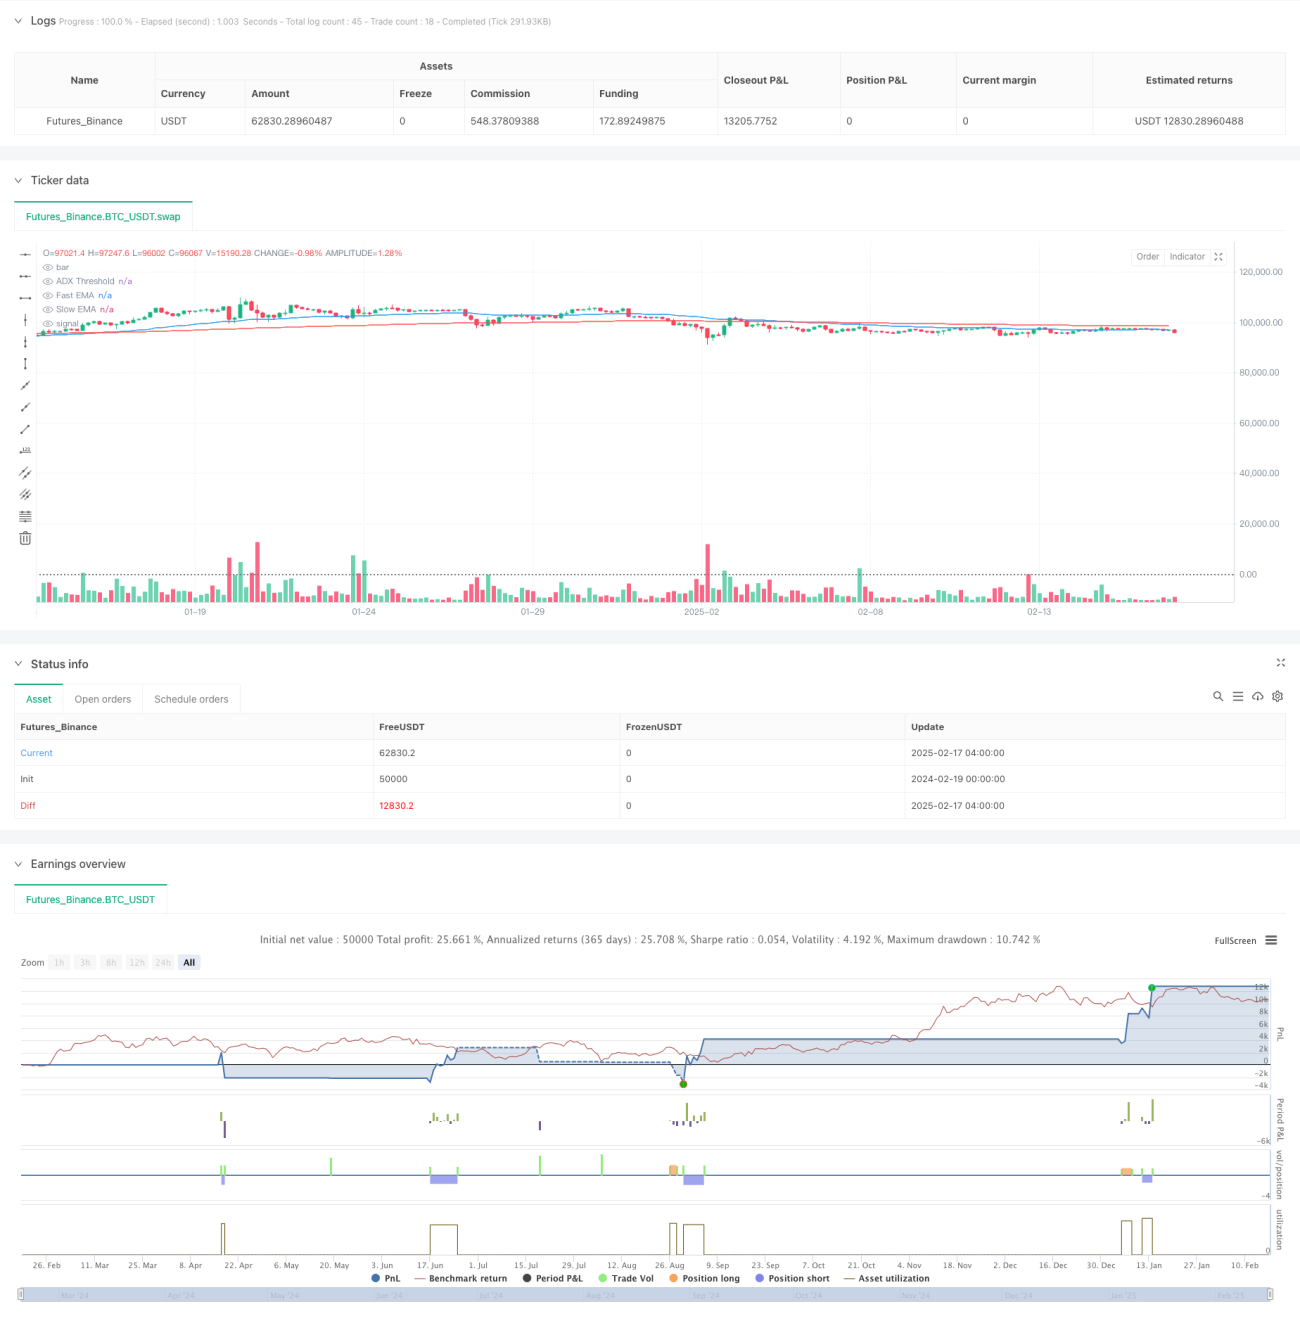
এই কৌশলটি একাধিক প্রযুক্তিগত সূচকের উপর ভিত্তি করে একটি প্রবণতা-অনুসরণ কৌশল, যা একাধিক প্রযুক্তিগত সূচক যেমন চলমান গড় ((EMA), গড় প্রবণতা সূচক ((ADX) এবং অপেক্ষাকৃত দুর্বল সূচক ((RSI) এর সমন্বয় করে এবং একাধিক টাইম ফ্রেম বিশ্লেষণ পদ্ধতির সাথে মিলিত হয়। কৌশলটি মূলত দ্রুত এবং ধীর গতির ইএমএর ক্রস দ্বারা প্রবণতার দিকনির্দেশ নিশ্চিত করে, ADX ব্যবহার করে প্রবণতার শক্তিকে ফিল্টার করে এবং RSI দ্বারা বাজারের গতিশীলতা বিচার করে, যার ফলে 1 মিনিটের চার্টে উচ্চ-ফ্রিকোয়েন্সি ট্রেডিং হয়। রিটার্নিং ফলাফল দেখায় যে কৌশলটি 76.92% বিজয়ী হার এবং 1.819 মুনাফার ফ্যাক্টর রয়েছে, যা ভাল মুনাফার ক্ষমতা প্রদর্শন করে।
কৌশল নীতি
এই কৌশলটি নিম্নলিখিত মূল পদ্ধতির উপর ভিত্তি করে কাজ করেঃ
- ট্রেন্ডের দিকনির্দেশনা সনাক্ত করতে 50 এবং 200 পিরিয়ডের ইএমএ ব্যবহার করা হয়, ফাস্ট লাইন এবং ধীর লাইনের ক্রস দ্বারা প্রবেশের সংকেত নিশ্চিত করা হয়
- ADX সূচক ((14 চক্র) ব্যবহার করে প্রবণতা শক্তি মূল্যায়ন করুন, কেবলমাত্র ADX 25 এর চেয়ে বড় হলে প্রবেশ করুন, বাজারের ঝড় এড়াতে
- আরএসআই সূচক ((১৪ চক্র) এর সাথে মিলিত গতিশীলতা বিশ্লেষণ করুন, আরএসআই ৩০ এর নিচে থাকলে অতিরিক্ত বিবেচনা করুন এবং ৭০ এর উপরে থাকলে শূন্য বিবেচনা করুন
- 4 ঘন্টা সময় ফ্রেম EMA বিশ্লেষণ প্রবর্তন, মাল্টি সময় ফ্রেম নিশ্চিতকরণ দ্বারা প্রবণতা বিচার নির্ভরযোগ্যতা বৃদ্ধি
- ডায়নামিক স্টপ লস সেট করুন, একটি প্লাস স্টপ লস প্রবেশ মূল্যের 5% এ এবং স্টপ লস 2% এ অবস্থিত; বিপরীতভাবে বিপরীত করুন
কৌশলগত সুবিধা
- একাধিক সূচক ক্রস যাচাইকরণ, সিগন্যাল নির্ভরযোগ্যতা উল্লেখযোগ্যভাবে উন্নত
- গতিশীল ক্ষতি এবং অস্থিরতা-ভিত্তিক পজিশন ব্যবস্থাপনা সহ একটি শক্তিশালী ঝুঁকি নিয়ন্ত্রণ ব্যবস্থা
- মাল্টি টাইম ফ্রেম বিশ্লেষণের মাধ্যমে ভুয়া আক্রমণের ঝুঁকি কমানো সম্ভব
- উচ্চ বিজয় হার এবং মাঝারি লাভ-ক্ষতির অনুপাত, ভাল প্রত্যাশিত আয়
- কৌশল যুক্তি পরিষ্কার এবং বোঝা সহজ এবং বজায় রাখা
কৌশলগত ঝুঁকি
- দ্রুত ও তীব্র বাজারের অস্থিরতা বন্ধের কার্যকারিতা হ্রাস করতে পারে
- ট্রেডিংয়ের খরচ বাড়ানোর জন্য ঘন ঘন লেনদেন হতে পারে
- ইএমএ সূচক নিজেই পিছিয়ে আছে এবং সম্ভবত সেরা প্রবেশের সময়টি মিস করেছে
- একাধিক সূচক পরস্পরবিরোধী সংকেত দিতে পারে
- 1 মিনিট চক্রের লেনদেনের জন্য উচ্চতর কার্যকরকরণের গতির প্রয়োজনীয়তা রয়েছে, যার ফলে স্লাইড পয়েন্টের ঝুঁকি থাকতে পারে
কৌশল অপ্টিমাইজেশনের দিকনির্দেশনা
- ট্রেন্ড সনাক্তকরণের নির্ভুলতা বাড়ানোর জন্য ADX মসৃণকরণ প্যারামিটারগুলি অপ্টিমাইজ করুন
- এটিআর ভিত্তিক গতিশীল পজিশন ম্যানেজমেন্টের প্রবর্তন, যা বাজারের অস্থিরতার সাথে আরও ভালভাবে খাপ খায়
- ট্রেডিং ভলিউম বিশ্লেষণের মাত্রা বাড়ান এবং সিগন্যালের নির্ভরযোগ্যতা উন্নত করুন
- বিভিন্ন বাজারের অবস্থার জন্য বিভিন্ন প্যারামিটারের সমন্বয় ব্যবহার করে বাজার পরিবেশের শ্রেণিবিন্যাস যুক্ত করার বিষয়টি বিবেচনা করুন
- মেশিন লার্নিং অ্যালগরিদমের সমন্বয়, প্যারামিটার নির্বাচন অপ্টিমাইজ করার চেষ্টা করা যেতে পারে
সারসংক্ষেপ
এই কৌশলটি একাধিক প্রযুক্তিগত সূচকগুলির সমন্বয় দ্বারা একটি শক্তিশালী প্রবণতা ট্র্যাকিং সিস্টেম তৈরি করে। কৌশলটি উচ্চ সাফল্য বজায় রেখে, একটি উন্নত ঝুঁকি নিয়ন্ত্রণ ব্যবস্থা দ্বারা উল্লেখযোগ্য লাভ অর্জন করে। যদিও কিছু অপ্টিমাইজেশনের জায়গা রয়েছে তবে সামগ্রিকভাবে এটি সন্তোষজনক, বিশেষত স্থিতিশীল লাভের জন্য ট্রেডারদের জন্য উপযুক্ত।
/*backtest
start: 2024-02-19 00:00:00
end: 2025-02-17 08:00:00
period: 4h
basePeriod: 4h
exchanges: [{"eid":"Futures_Binance","currency":"BTC_USDT"}]
*/

//@version=5
strategy("Enhanced Trend Following Strategy", overlay=true, default_qty_type=strategy.percent_of_equity, default_qty_value=200)

// === INPUTS ===- 1