
ওভারভিউ
এটি একটি উচ্চ-ফ্রিকোয়েন্সি ট্রেডিং কৌশল সিস্টেম যা বোলিংগার ব্যান্ডস, মুভিং এভারেজ ডিসঅ্যাপারেশন (এমএসিডি) এবং ট্রেডিং ভলিউম বিশ্লেষণের সাথে মিলিত। এই কৌশলটি বাজারের বিপর্যয়ের সুযোগগুলিকে ধরে রাখার জন্য বোলিংগার ব্যান্ডে দামের বিপর্যয় এবং বিপর্যয় চিহ্নিত করে, এমএসিডি গতিশীলতা সূচক এবং ট্রেডিং ভলিউম নিশ্চিতকরণের সাথে মিলিত হয়। সিস্টেমটি প্রতিদিনের সর্বোচ্চ লেনদেনের সীমা নির্ধারণ করে এবং একটি উন্নত ঝুঁকি ব্যবস্থাপনার সাথে সজ্জিত।
কৌশল নীতি
এই কৌশলটি মূলত তিনটি মূল সূচকের উপর ভিত্তি করে তৈরি করা হয়েছেঃ
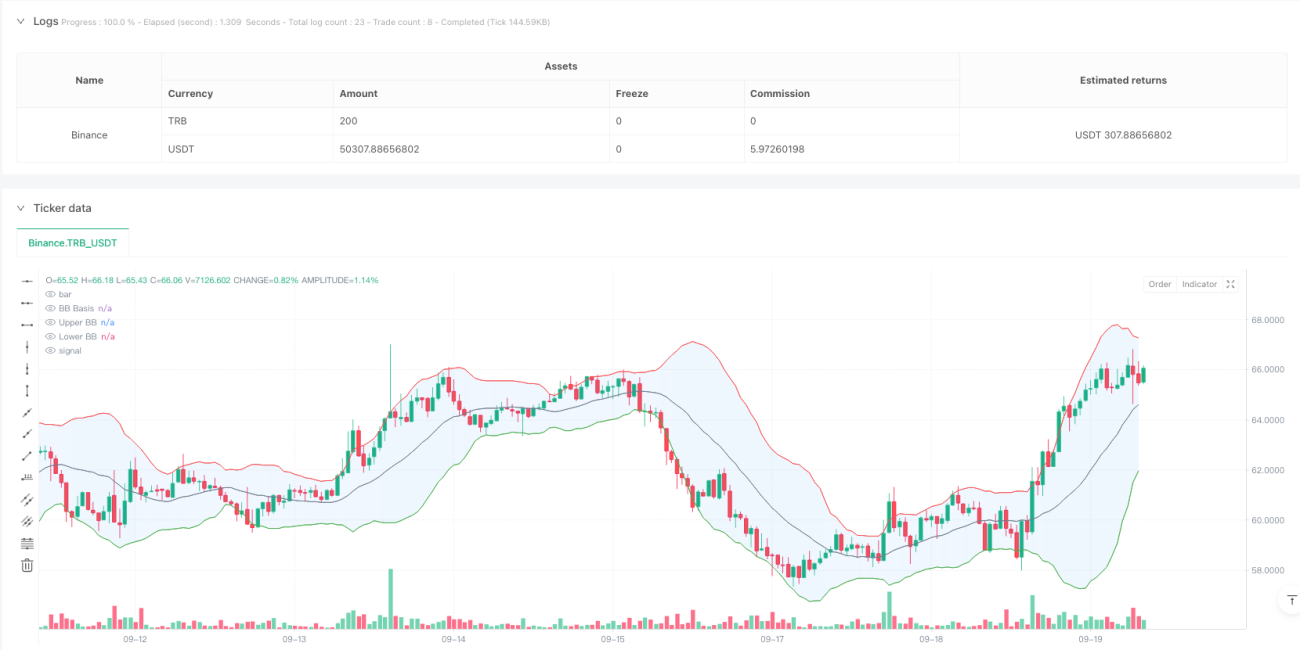
- বুলিন বন্ড সূচকঃ ২০-চক্রের সরল চলমান গড় ((এসএমএ) ব্যবহার করে, স্ট্যান্ডার্ড ডিফারেনশিয়ালের গুণিতক ২.০ হিসাবে গণনা করা হয়। যখন দামগুলি বুলিন বন্ডের পরে ফিরে আসে, তখন সিস্টেমটি সম্ভাব্য লেনদেনের সংকেত দেয়।
- MACD সূচকঃ স্ট্যান্ডার্ড প্যারামিটার সেটিং ((12,26,9) ব্যবহার করে, দামের প্রবণতা গতিশীলতা নিশ্চিত করার জন্য। যখন MACD লাইনটি সংকেত লাইনের উপরে থাকে তখন একটি মাল্টি সংকেত নিশ্চিত করে এবং যখন সংকেত লাইনের নীচে থাকে তখন একটি ফাঁকা সংকেত নিশ্চিত করে।
- লেনদেনের পরিমাণ বিশ্লেষণঃ লেনদেনের পরিমাণ নিশ্চিত করার জন্য 20 পিরিয়ডের চলমান গড় ব্যবহার করা হয়। বাজারের অংশগ্রহণ নিশ্চিত করার জন্য সিগন্যালের সময় লেনদেনের পরিমাণ কমপক্ষে গড় হওয়া উচিত।
কৌশলগত সুবিধা
- একাধিক সংকেত নিশ্চিতকরণঃ ব্রিনব্যান্ড, MACD এবং লেনদেনের ভলিউম তিনবার যাচাইকরণের মাধ্যমে লেনদেনের সংকেতের নির্ভরযোগ্যতা উল্লেখযোগ্যভাবে বৃদ্ধি পেয়েছে।
- ভিজ্যুয়াল ডিজাইনঃ সিস্টেমটি প্রচুর চার্ট নির্দেশাবলী সরবরাহ করে, যার মধ্যে রয়েছে ব্রিন ব্যান্ডেজ ভর্তি, সংকেত চিহ্নিতকরণ এবং পটভূমির রঙ পরিবর্তন, যা ব্যবসায়ীদের দ্রুত ব্যবসায়ের সুযোগগুলি সনাক্ত করতে সহায়তা করে।
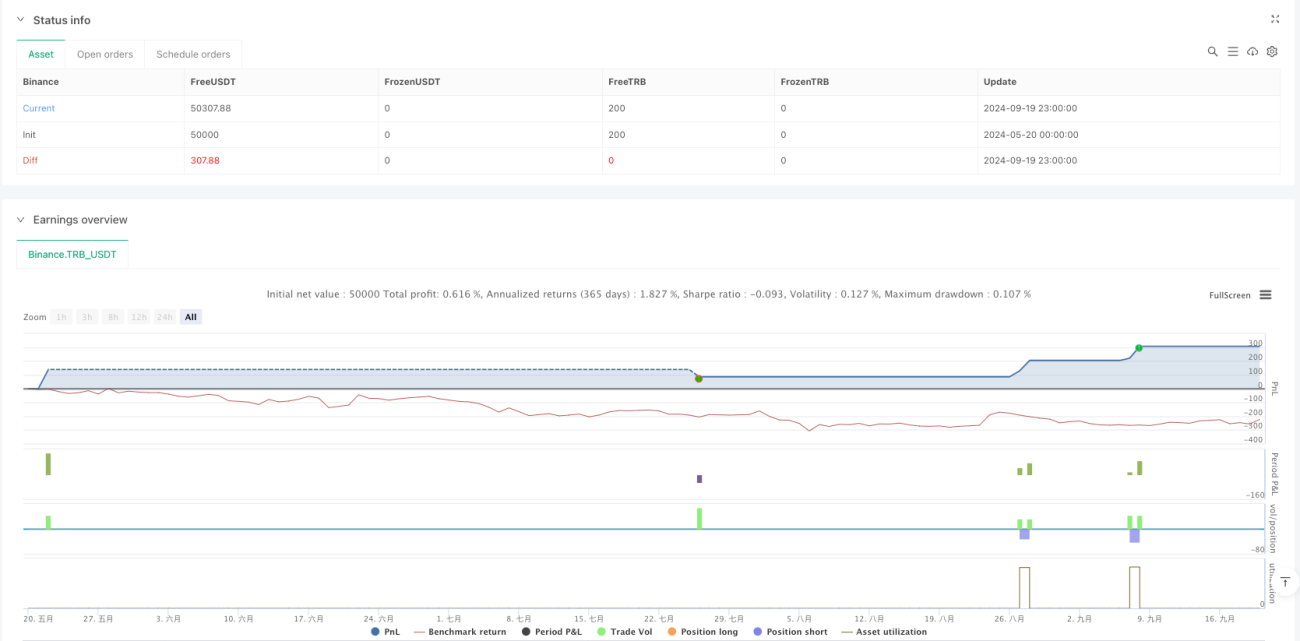
- ঝুঁকি নিয়ন্ত্রণের দক্ষতাঃ স্থির স্টপ লস এবং লাভের লক্ষ্যমাত্রা প্রয়োগ করা হয়েছে এবং প্রতিদিনের সর্বোচ্চ লেনদেনের সীমাবদ্ধতা রয়েছে, যা ঝুঁকি ফাঁককে কার্যকরভাবে নিয়ন্ত্রণ করে।
- পদ্ধতিগত অপারেশনঃ কৌশলটি স্পষ্ট প্রবেশ এবং প্রস্থান শর্ত সরবরাহ করে, যা বিষয়গত বিচারের দ্বারা সৃষ্ট অনিশ্চয়তা হ্রাস করে।
কৌশলগত ঝুঁকি
- বাজারের অস্থিরতার ঝুঁকিঃ উচ্চ অস্থিরতার বাজারে, মিথ্যা ব্রেকিং সিগন্যাল দেখা দিতে পারে, যার ফলে লেনদেনের ক্ষতি হতে পারে।
- স্লাইড পয়েন্টের ঝুঁকিঃ উচ্চ-ফ্রিকোয়েন্সি ট্রেডিংয়ের পরিবেশে, প্রকৃত উপার্জনকে প্রভাবিত করে বড় স্লাইড পয়েন্টের খরচ হতে পারে।
- তরলতা ঝুঁকিঃ বাজারে তরলতা না থাকায় লেনদেনের পরিমাণের শর্তগুলি লেনদেনের সুযোগকে সীমাবদ্ধ করতে পারে।
- সিস্টেমিক ঝুঁকিঃ নির্দিষ্ট প্যারামিটার সেটিং বাজারের অবস্থার তীব্র পরিবর্তনের সাথে মানিয়ে নিতে পারে না।
কৌশল অপ্টিমাইজেশনের দিকনির্দেশনা
- প্যারামিটার ডায়নামিক অপ্টিমাইজেশানঃ স্বনির্ধারিত প্যারামিটার সমন্বয় ব্যবস্থা চালু করা যেতে পারে, যাতে ব্রিনব্যান্ড এবং এমএসিডি প্যারামিটারগুলি বাজারের অবস্থার সাথে স্বয়ংক্রিয়ভাবে সামঞ্জস্য করতে পারে।
- মার্কেট সাইক্লিক আইডেন্টিফিকেশনঃ মার্কেট সাইক্লিক বিচার মডিউল যোগ করা, বিভিন্ন মার্কেট সাইক্লিকের মধ্যে বিভিন্ন ট্রেডিং কৌশল ব্যবহার করা।
- ঝুঁকি ব্যবস্থাপনার অপ্টিমাইজেশানঃ বাজারের অস্থিরতার উপর নির্ভর করে স্টপ পজিশনের সমন্বয় করার জন্য একটি গতিশীল স্টপ ব্যবস্থা চালু করার বিষয়টি বিবেচনা করা যেতে পারে।
- সংকেত ফিল্টারিং উন্নতঃ প্রবণতা শক্তি ফিল্টার বৃদ্ধি করুন, যাতে হরফ বাজারগুলিতে অত্যধিক ট্রেডিং সংকেত তৈরি না হয়।
সারসংক্ষেপ
এই কৌশলটি একটি সম্পূর্ণ ট্রেডিং সিস্টেম তৈরি করে, যার মধ্যে রয়েছে ব্রিনের বিপরীত সিগন্যাল, ম্যাকড ট্রেন্ড নিশ্চিতকরণ এবং ট্রেডিং ভলিউম যাচাইকরণ। সিস্টেমের ভিজ্যুয়ালাইজড ডিজাইন এবং কঠোর ঝুঁকি নিয়ন্ত্রণ এটিকে বিশেষভাবে দিনের ব্যবসায়ের জন্য উপযুক্ত করে তোলে। যদিও কিছু বাজার ঝুঁকি রয়েছে, ক্রমাগত অপ্টিমাইজেশন এবং প্যারামিটার সমন্বয় দ্বারা কৌশলটি বিভিন্ন বাজার পরিবেশে স্থিতিশীল পারফরম্যান্স বজায় রাখার সম্ভাবনা রয়েছে।
- 1