মাল্টি-পিরিয়ড ট্রেন্ড ট্র্যাকিং এবং ভলিউম নিশ্চিতকরণ কৌশল

ওভারভিউ
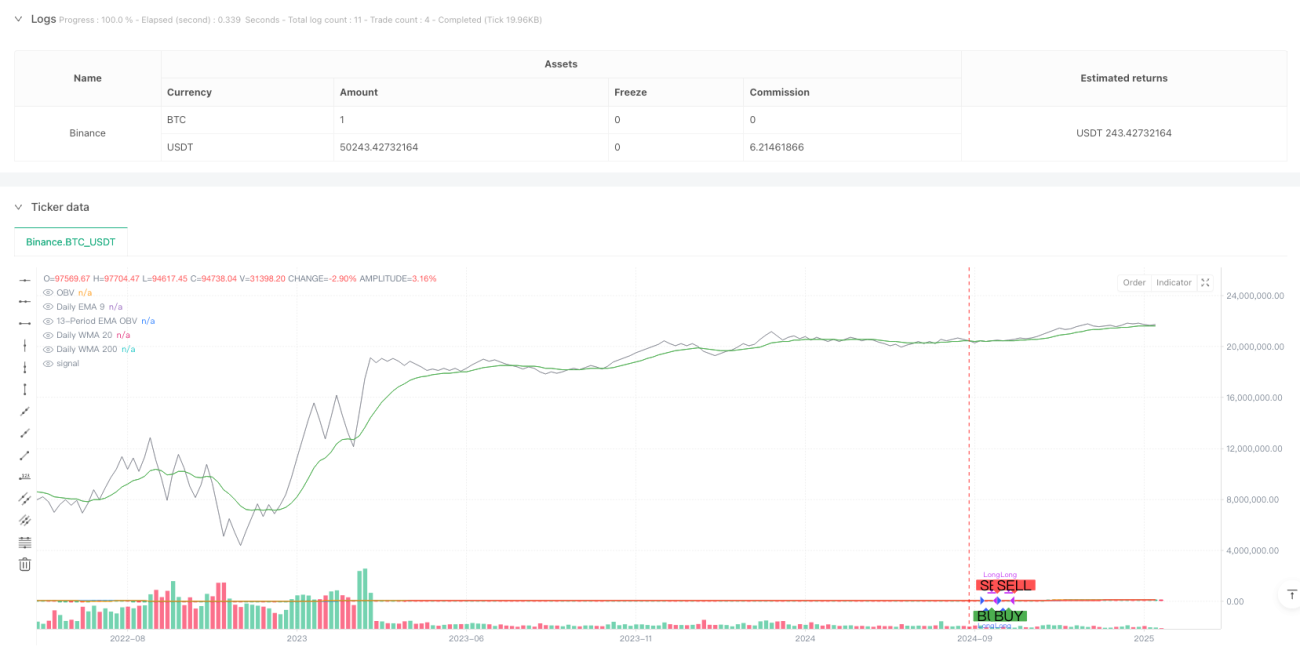
এই কৌশলটি একটি প্রবণতা ট্র্যাকিং সিস্টেম যা বহু-চক্রীয় চলমান গড় এবং লেনদেনের পরিমাণ বিশ্লেষণের সাথে মিলিত হয়। কৌশলটি সামগ্রিক প্রবণতা নিশ্চিত করার জন্য দৈনিক চক্রের EMA9, WMA20 এবং WMA200 এর তিনটি গড় লাইন ব্যবহার করে এবং OBV (অন ব্যালেন্স ভলিউম) সূচক এবং তার EMA এর সাথে লেনদেনের পরিমাণ নিশ্চিত করার জন্য আরও স্থিতিশীল প্রবণতা ট্র্যাকিং লেনদেনের জন্য।
কৌশল নীতি
কৌশলটি দুটি মূল শর্তের উপর ভিত্তি করে কাজ করেঃ
- প্রবণতা নিশ্চিতকরণ - তিনটি দৈনিক গড় লাইন (ইএমএ 9, ডাব্লুএমএ 20, ডাব্লুএমএ 200) বৃদ্ধি পেয়েছে কিনা তা বিচার করে প্রবণতার দিকনির্দেশনা নিশ্চিত করুন। যখন তিনটি গড় লাইন উপরে ঝুঁকে থাকে, তখন প্রতিটি সময়কালই একাধিক প্রবণতা দেখায়।
- লেনদেনের পরিমাণ নিশ্চিতকরণ - লেনদেনের পরিমাণ বিশ্লেষণের জন্য ওবিভি সূচক এবং তার 13 চক্রের ইএমএ ব্যবহার করুন। যখন ওবিভির ইএমএ ওবিভির উপরে থাকে, তখন লেনদেনের পরিমাণ সমর্থন করে দাম বাড়ানো এবং প্রবণতার কার্যকারিতা নিশ্চিত করে।
এই দুটি শর্ত একই সাথে পূরণ হলেই কৌশলটি একটি মাল্টিসিগন্যাল তৈরি করবে। যখন কোনও শর্ত পূরণ হবে না, তখন কৌশলটি সমতল হয়ে যাবে।
কৌশলগত সুবিধা
- মাল্টিপল টাইম ফ্রেম বিশ্লেষণ - স্বল্পমেয়াদী (ইএমএ-৯), মধ্যমেয়াদী (ডাব্লুএমএ-২০) এবং দীর্ঘমেয়াদী (ডাব্লুএমএ-২০০) প্রবণতাগুলিকে সামগ্রিকভাবে বিবেচনা করে ভুয়া বিরতির ঝুঁকি হ্রাস করুন।
- লেনদেনের পরিমাণে সমর্থন - OBV সূচক বিশ্লেষণের প্রবর্তন, যাতে দামের গতিশীলতা লেনদেনের পরিমাণে সমর্থিত হয় তা নিশ্চিত করে।
- রিস্ক কন্ট্রোল - শতকরা পজিশন ম্যানেজমেন্ট এবং ফি বিবেচনা করে, যা প্রকৃত ট্রেডিং পরিবেশের সাথে আরও সামঞ্জস্যপূর্ণ।
- ভিজ্যুয়াল সাপোর্ট - ট্রেডারদের প্রবেশ এবং প্রস্থান সময় বুঝতে সাহায্য করার জন্য একটি স্পষ্ট গ্রাফিক চিহ্নিতকরণ।
কৌশলগত ঝুঁকি
- প্রবণতা বিপরীতের বিলম্ব - একাধিক গড় লাইন নিশ্চিতকরণের কারণে প্রবণতা বিপরীতের প্রাথমিক প্রতিক্রিয়া হতে পারে।
- ঝাঁকুনির বাজার প্রযোজ্য নয় - ক্রমাগত মিথ্যা ব্রেকআপের ফলে অতিরিক্ত লেনদেন হতে পারে।
- মূলধন খরচ বিবেচনা করা - 0.1% এর কমিশনগুলি উচ্চ-প্রবাহের লেনদেনের ক্ষেত্রে আয়কে উল্লেখযোগ্যভাবে প্রভাবিত করতে পারে।
কৌশল অপ্টিমাইজেশনের দিকনির্দেশনা
- উদ্বায়ীতা সূচক প্রবর্তন করা - এটিআর এর মতো উদ্বায়ীতা সূচক যুক্ত করার কথা বিবেচনা করা যেতে পারে, যা বিভিন্ন বাজারের পরিস্থিতিতে পজিশনের গতিশীল সমন্বয় করে।
- স্টপ লস ম্যানেজমেন্ট উন্নত করা হয়েছে - ট্র্যাকিং স্টপ লস ফাংশন যুক্ত করার পরামর্শ দেওয়া হয়েছে, যাতে মুনাফা আরও ভালভাবে সুরক্ষিত থাকে।
- মার্কেট এনভায়রনমেন্ট ফিল্টার - মার্কেট এনভায়রনমেন্টের বিচার করার জন্য একটি সূচক যোগ করা যায়, যা অস্থির বাজারগুলিতে ট্রেডিং ফ্রিকোয়েন্সি কমিয়ে দেয় বা ট্রেডিং স্থগিত করে।
- অপ্টিমাইজেশন প্যারামিটার নির্বাচন করুন - বিভিন্ন বাজার এবং জাতের জন্য গড় লাইন চক্র এবং ওবিভি প্যারামিটারগুলির জন্য অপ্টিমাইজেশন বিবেচনা করুন।
সারসংক্ষেপ
এই কৌশলটি বহু-চক্রের প্রবণতা বিশ্লেষণ এবং লেনদেনের পরিমাণ নিশ্চিতকরণের সাথে একত্রিত করে একটি অপেক্ষাকৃত সম্পূর্ণ প্রবণতা ট্র্যাকিং সিস্টেম তৈরি করে। কৌশলগত যুক্তি পরিষ্কার, ঝুঁকি নিয়ন্ত্রণ যুক্তিসঙ্গত, তবে এখনও অপ্টিমাইজেশনের জন্য জায়গা রয়েছে। ব্যবসায়ীদের পরামর্শ দেওয়া হয় যে তারা বাস্তব বাজারে সাবধানতার সাথে পরীক্ষা করুন এবং নির্দিষ্ট বাজারের বৈশিষ্ট্য অনুসারে প্যারামিটারগুলি সামঞ্জস্য করুন।
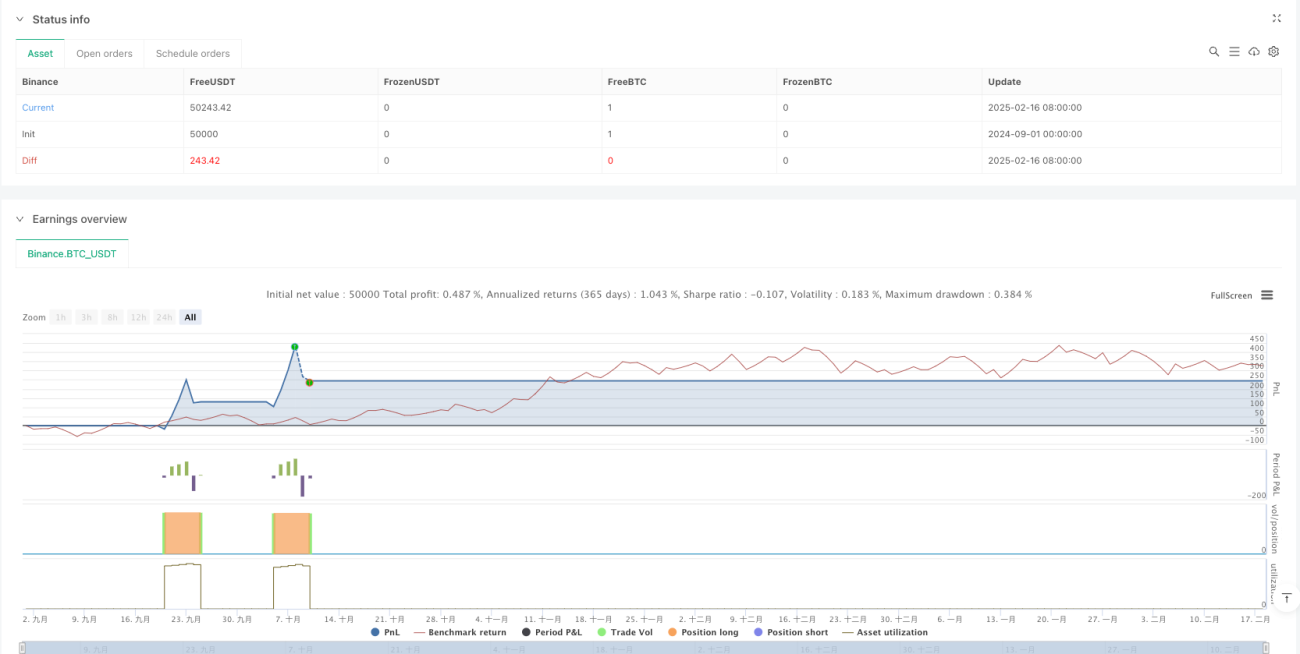
/*backtest
start: 2024-09-01 00:00:00
end: 2025-02-18 08:00:00
period: 5d
basePeriod: 5d
exchanges: [{"eid":"Binance","currency":"BTC_USDT"}]
*/

//@version=6
strategy("Strategy: Daily MAs + OBV", overlay=true, initial_capital=10000, default_qty_type=strategy.percent_of_equity, default_qty_value=10, commission_type=strategy.commission.percent, commission_value=0.1)

//=== Daily Moving Averages Calculation =========================- 1