মোমেন্টাম ট্রেন্ড সুপারট্রেন্ড এবং স্টোকাস্টিক ক্রসওভার কৌশল

ওভারভিউ
এই কৌশলটি একটি ট্রেডিং সিস্টেম যা সুপারট্রেন্ড সূচক এবং স্টোক্যাস্টিক ওসিলিটারের সাথে প্রবণতা অনুসরণ করে। এই কৌশলটি সুপারট্রেন্ড সূচকের মাধ্যমে বাজার প্রবণতার দিকটি সনাক্ত করে এবং এলোমেলো সূচকের ওভার-বিক্রয় ওভার-বিক্রয় সংকেতকে লেনদেনের নিশ্চিতকরণ সংকেত হিসাবে ব্যবহার করে। কৌশলটি প্রবণতার দিকের মধ্যে সর্বোত্তম প্রবেশ এবং প্রস্থান সময় সন্ধান করার জন্য গতিশীল ক্রস পদ্ধতি ব্যবহার করে, যা প্রবণতা ট্র্যাকিং এবং গতিশীল বিশ্লেষণের নিখুঁত সমন্বয় করে।
কৌশল নীতি
এই কৌশলটির মূল যুক্তিটি দুটি প্রধান সূচকের উপর ভিত্তি করে তৈরি করা হয়েছেঃ
- সুপারট্রেন্ড সূচকঃ এটিআর (অর্ধ-সত্যিকারের তরঙ্গ) এর উপর ভিত্তি করে গণনা করা হয়, যা বাজারের প্রবণতা নির্ধারণের জন্য ব্যবহৃত হয়। সূচক লাইনটি লাল হয়ে গেলে এটির উত্থানকে নির্দেশ করে, যখন এটি সবুজ হয়ে যায়, এবং যখন এটি সবুজ হয়ে যায় তখন এটির পতনকে নির্দেশ করে। সূচক প্যারামিটারটি এটিআর চক্রের 10 ব্যবহার করে, গুণিতক ফ্যাক্টর 3.0।
- এলোমেলো সূচকঃ বাজারের ওভারবয় ওভারসেল অবস্থা সনাক্ত করতে ব্যবহৃত হয়। %K চক্রের জন্য 14,%D চক্রের জন্য 3 প্যারামিটার সেটিং, ওভারবয় স্তর 80 এবং ওভারসেল স্তর 20।
লেনদেনের নিয়মাবলী নিম্নরূপঃ
- একাধিক শর্তঃ সুপারট্রেন্ড একটি উচ্চতর প্রবণতা দেখায় (সবুজ) এবং এলোমেলো সূচক% কে লাইনটি নীচে থেকে ওভারসোল্ড স্তরটি অতিক্রম করে (২০)
- ব্রেকিং শর্তঃ সুপারট্রেন্ড নিম্নমুখী প্রবণতা দেখায় (লাল), এবং এলোমেলো সূচক% কে লাইনটি ওভারব্রেকিং স্তরটি (৮০) উপরের থেকে নীচে অতিক্রম করে
- সুপারট্রেন্ডটি নিম্নমুখী হয়ে যায়, অথবা এলোমেলো সূচক %K লাইনটি ওভারবয় স্তরটি অতিক্রম করে
- সমতল শর্তঃ সুপারট্রেন্ডটি একটি উত্থানের ট্রেন্ডে পরিণত হয়, বা এলোমেলো সূচক% কে লাইনটি ওভারসোলের স্তরটি অতিক্রম করে
কৌশলগত সুবিধা
- প্রবণতা সনাক্তকরণঃ সুপারট্রেন্ড সূচকগুলির মাধ্যমে বাজারের মূল প্রবণতাকে কার্যকরভাবে সনাক্ত করুন, মিথ্যা ব্রেকআউটের ঝুঁকি হ্রাস করুন
- ডায়নামিক যাচাইকরণঃ ডায়নামিক সিগন্যালের সাথে এলোমেলো সূচক যুক্ত করে ট্রেডিংয়ের নির্ভুলতা এবং সময়োপযোগীতা বাড়ায়
- ঝুঁকি নিয়ন্ত্রণঃ সুস্পষ্ট ঝুঁকি ব্যবস্থাপনার কাঠামো প্রদানের জন্য ওভার-বই ওভার-সেল স্তরকে স্টপ লস স্টপ রেফারেন্স হিসেবে ব্যবহার করা
- ভিজ্যুয়ালাইজেশনঃ ট্রেডারদের বাজারের অবস্থা বুঝতে সহায়তা করার জন্য কৌশলগুলি একটি স্বজ্ঞাত গ্রাফিকাল ইন্টারফেস সরবরাহ করে, যার মধ্যে ট্রেন্ডের পটভূমির রঙ এবং সূচক লাইনের পরিবর্তন অন্তর্ভুক্ত রয়েছে
- প্যারামিটারগুলির নমনীয়তাঃ সমস্ত মূল প্যারামিটারগুলিকে বিভিন্ন বাজারের বৈশিষ্ট্যগুলির সাথে সামঞ্জস্য করে অপ্টিমাইজ করা যায়
কৌশলগত ঝুঁকি
- বাজারের ঝড়ের ঝুঁকিঃ ঘন ঘন মিথ্যা সংকেত সৃষ্টি হতে পারে, যার ফলে ওভারট্রেডিং হতে পারে
- পিছিয়ে পড়ার ঝুঁকিঃ সুপারট্রেন্ড এবং এলোমেলো সূচক উভয়ই কিছুটা পিছিয়ে রয়েছে, সম্ভবত সেরা প্রবেশের সময়টি মিস করেছে
- প্যারামিটার সংবেদনশীলতাঃ বিভিন্ন প্যারামিটার সেটিংগুলি উল্লেখযোগ্যভাবে বিভিন্ন লেনদেনের ফলাফলের দিকে পরিচালিত করতে পারে, যা পুঙ্খানুপুঙ্খভাবে পরীক্ষা করা দরকার
- বাজার পরিস্থিতির উপর নির্ভরশীলতাঃ কৌশলটি শক্তিশালী প্রবণতা বাজারে ভাল কাজ করে, তবে তীব্র অস্থিরতার সময় খারাপ হতে পারে
- সিগন্যাল সংঘর্ষঃ দুটি সূচকের মধ্যে দ্বন্দ্বপূর্ণ সংকেত তৈরি হতে পারে এবং সুস্পষ্ট অগ্রাধিকারের নিয়ম স্থাপন করা প্রয়োজন
কৌশল অপ্টিমাইজেশনের দিকনির্দেশনা
- ওঠানামা ফিল্টার চালু করা হয়েছেঃ এটিআর থ্রেশহোল্ডের বিচার যুক্ত করা যেতে পারে, যখন ওঠানামা খুব বেশি হয় তখন ট্রেডিং স্থগিত করা যায়
- সিগন্যাল নিশ্চিতকরণ প্রক্রিয়া অপ্টিমাইজ করুনঃ সিগন্যালের নির্ভরযোগ্যতা বাড়ানোর জন্য চলমান গড়ের মতো সহায়ক সূচকগুলি যুক্ত করার কথা বিবেচনা করা যেতে পারে
- স্টপ লস ম্যানেজমেন্ট উন্নত করুনঃ ট্র্যাকিং স্টপ লস বৈশিষ্ট্য যুক্ত করার পরামর্শ দেওয়া হয়েছে, যা প্রাপ্ত মুনাফা আরও সুরক্ষিত করে
- সময় ফিল্টার যুক্ত করুনঃ বিভিন্ন সময়কালের বাজারের বৈশিষ্ট্য অনুসারে কৌশলগত প্যারামিটারগুলি সামঞ্জস্য করতে বা লেনদেন স্থগিত করতে পারেন
- অভিযোজনযোগ্যতা প্যারামিটার বিকাশ করুনঃ বাজারের অবস্থার সাথে সামঞ্জস্য রেখে কৌশলগত প্যারামিটারগুলিকে গতিশীল করার জন্য অভিযোজনযোগ্যতা প্যারামিটার প্রক্রিয়া ডিজাইন করুন
সারসংক্ষেপ
এই কৌশলটি প্রবণতা ট্র্যাকিং এবং গতিশীলতা বিশ্লেষণের সাথে একত্রিত করে একটি মোটামুটি সম্পূর্ণ ট্রেডিং সিস্টেম তৈরি করে। এটি কেবল পরিষ্কার প্রবেশ এবং প্রস্থান সংকেত সরবরাহ করে না, তবে ঝুঁকি ব্যবস্থাপনা এবং প্যারামিটার অপ্টিমাইজেশনের জন্য একটি কাঠামোও রয়েছে। যদিও কিছু অন্তর্নিহিত ঝুঁকি রয়েছে, তবে অপ্টিমাইজেশনের পরামর্শ দেওয়া কৌশলটির স্থিতিশীলতা এবং অভিযোজনকে আরও বাড়িয়ে তুলতে পারে।
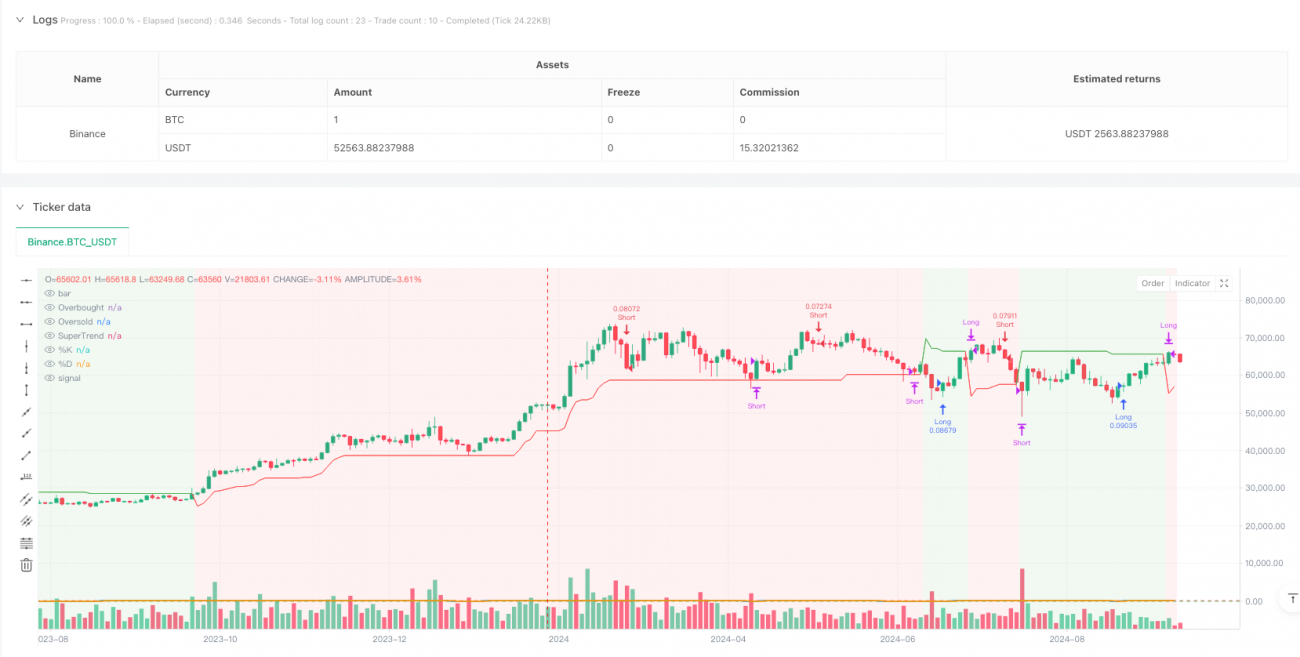
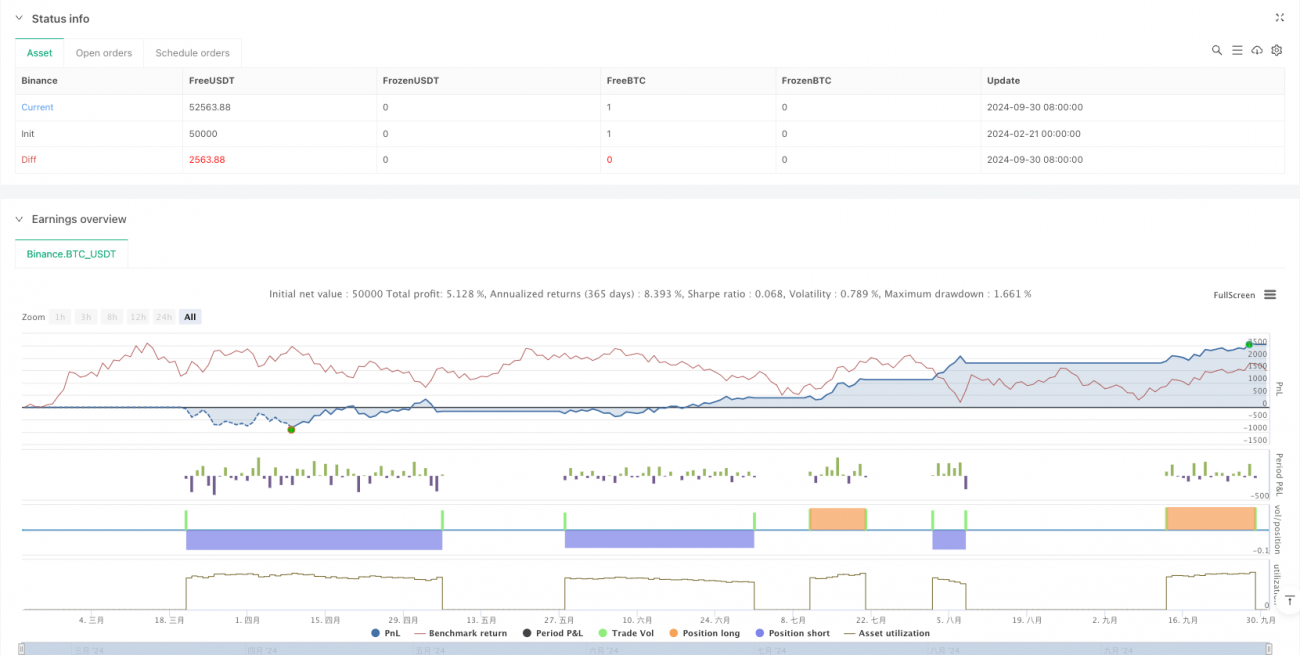
/*backtest
start: 2024-02-21 00:00:00
end: 2024-10-01 00:00:00
period: 2d
basePeriod: 2d
exchanges: [{"eid":"Binance","currency":"BTC_USDT"}]
*/

//@version=5
strategy("SuperTrend + Stochastic Strategy", overlay=true, default_qty_type=strategy.percent_of_equity, default_qty_value=10)

// SuperTrend Settings- 1