SRSI এবং MACD বুদ্ধিমান ঝুঁকি নিয়ন্ত্রণ ব্যবস্থার সাথে মিলিত গতিশীল অভিযোজিত মাল্টি-ইন্ডিকেটর ক্রসওভার কৌশল

ওভারভিউ
এই কৌশলটি একটি গতিশীল ট্রেডিং সিস্টেম যা র্যান্ডম তুলনামূলকভাবে দুর্বল সূচক ((এসআরএসআই) এবং চলমান গড় প্রবণতা / ছড়িয়ে পড়া সূচক ((এমএসিডি) এর সাথে মিলিত। এটি এটিআর সূচকের মাধ্যমে গতিশীলভাবে স্টপ লস এবং স্টপ পয়েন্টের স্থানগুলিকে সামঞ্জস্য করে, যা ঝুঁকির বুদ্ধিমান পরিচালনা করে। এই কৌশলটির মূলটি হ'ল একাধিক প্রযুক্তিগত সূচকের ক্রস-নিশ্চিতকরণের মাধ্যমে ট্রেডিং সংকেত তৈরি করা, যখন বাজারের অস্থিরতার সাথে পজিশন পরিচালনা করা হয়।
কৌশল নীতি
এই কৌশলটি নিম্নলিখিত মূল পদ্ধতির উপর ভিত্তি করে কাজ করেঃ
- এসআরএসআই সূচকের মধ্যে কে লাইন এবং ডি লাইনের পার্থক্য এবং কে লাইন এবং একীভূত ম্যাকডের মধ্যে পার্থক্য গণনা করে বাজারের প্রবণতা নির্ধারণ করুন
- কেনার শর্তগুলি একই সাথে পূরণ করতে হবেঃ কে-ডি বৈষম্য ইতিবাচক, কে-এমএসিডি বৈষম্য ইতিবাচক, এবং এমএসিডি নেমে যাওয়ার প্রবণতা নেই
- বিক্রির শর্তগুলি একই সাথে পূরণ করতে হবেঃ কে-ডি বিভাজন নেতিবাচক, কে-এমএসিডি বিভাজন নেতিবাচক, এবং এমএসিডি উত্থানের প্রবণতা নেই
- এটিআর ব্যবহার করে স্টপ লস এবং স্টপ দুরত্বের গতিশীল হিসাব করুন, ঝুঁকির ফ্যাক্টর দ্বারা গুণিত করুন এবং বাজারের অস্থিরতার সাথে খাপ খাইয়ে নিন
কৌশলগত সুবিধা
- মাল্টি সিগন্যাল কনফার্মেশন মেকানিজম লেনদেনের নির্ভরযোগ্যতা উল্লেখযোগ্যভাবে বৃদ্ধি করে এবং একটি একক সূচক দ্বারা সম্ভাব্য মিথ্যা সংকেত এড়ায়
- ডায়নামিক স্টপ লস স্টপ সেটিং বাজার ওঠানামা অনুযায়ী স্বয়ংক্রিয়ভাবে সামঞ্জস্য করতে সক্ষম, যা একটি ভাল রিস্ক-রিটার্ন অনুপাত প্রদান করে
- কৌশল ভাল অভিযোজনযোগ্যতা আছে, বিভিন্ন বাজারের পরিস্থিতিতে স্থিতিশীল কর্মক্ষমতা বজায় রাখতে পারে
- প্যারামিটারগুলি সামঞ্জস্যপূর্ণ, যা ব্যবসায়ীদের ব্যক্তিগত ঝুঁকি পছন্দ অনুসারে অপ্টিমাইজ করার অনুমতি দেয়
কৌশলগত ঝুঁকি
- বাজারের মধ্যে অত্যধিক ট্রেডিং সিগন্যাল সৃষ্টি হতে পারে, যার ফলে বাজারে ঘন ঘন প্রবেশ ও প্রস্থান হয়
- একাধিক সূচক ব্যবহারের ফলে সংকেত বিলম্বিত হতে পারে এবং দ্রুত পরিবর্তিত বাজারে সেরা সময় মিস করতে পারে
- এটিআর ঐতিহাসিক ওঠানামার উপর ভিত্তি করে এবং বাজারের ওঠানামার পরিবর্তনের সময় সময়মত অভিযোজিত হতে পারে না
- যুক্তিসঙ্গতভাবে ঝুঁকিপূর্ণ ফ্যাক্টর সেট করা প্রয়োজন, খুব বড় বা খুব ছোট কৌশল কার্যকারিতা প্রভাবিত করতে পারে
কৌশল অপ্টিমাইজেশনের দিকনির্দেশনা
- প্রবণতা ফিল্টার যুক্ত করুন, অস্থির বাজার এবং প্রবণতা বাজারগুলিতে বিভিন্ন সংকেত স্বীকৃতি মানদণ্ড ব্যবহার করুন
- ট্র্যাফিকের পরিমাপকে সাহায্যকারী নিশ্চিতকরণ হিসাবে সংকেতের নির্ভরযোগ্যতা বাড়ানোর জন্য চালু করা হয়েছে
- স্টপ-ড্যামেজ স্টপ গণনা পদ্ধতির অপ্টিমাইজেশন, সমর্থন প্রতিরোধের অবস্থানের সাথে বিবেচনা করা যেতে পারে
- বাজারের অস্থিরতার পূর্বাভাস মডেল যোগ করুন এবং ঝুঁকি পরামিতিগুলিকে আগে থেকে সামঞ্জস্য করুন
- বিভিন্ন সময়কালের উপর সংকেত নিশ্চিতকরণ বিবেচনা করুন, কৌশলটির স্থিতিশীলতা বাড়ান
সারসংক্ষেপ
এই কৌশলটি এসআরএসআই এবং এমএসিডি এর সুবিধাগুলিকে একত্রিত করে একটি শক্তিশালী ট্রেডিং সিস্টেম তৈরি করে। গতিশীল ঝুঁকি ব্যবস্থাপনা ব্যবস্থাটি এটিকে ভালভাবে অভিযোজ্য করে তোলে, তবে এখনও ব্যবসায়ীদের প্রকৃত বাজার পরিস্থিতির উপর ভিত্তি করে প্যারামিটার অপ্টিমাইজ করার প্রয়োজন হয়। কৌশলটির সফল অপারেশন বাজার সম্পর্কে গভীর বোঝার প্রয়োজন এবং যুক্তিসঙ্গত পজিশন পরিচালনার জন্য ব্যক্তির ঝুঁকি বহনযোগ্যতার সাথে মিলিত হয়।
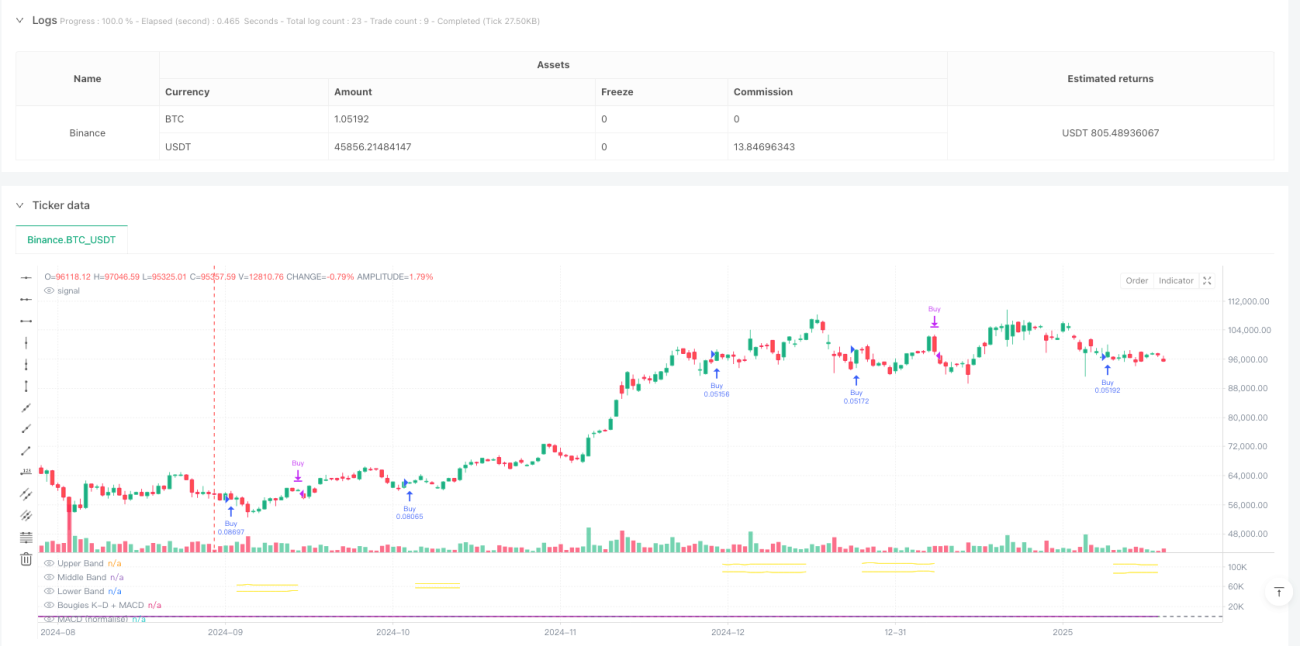
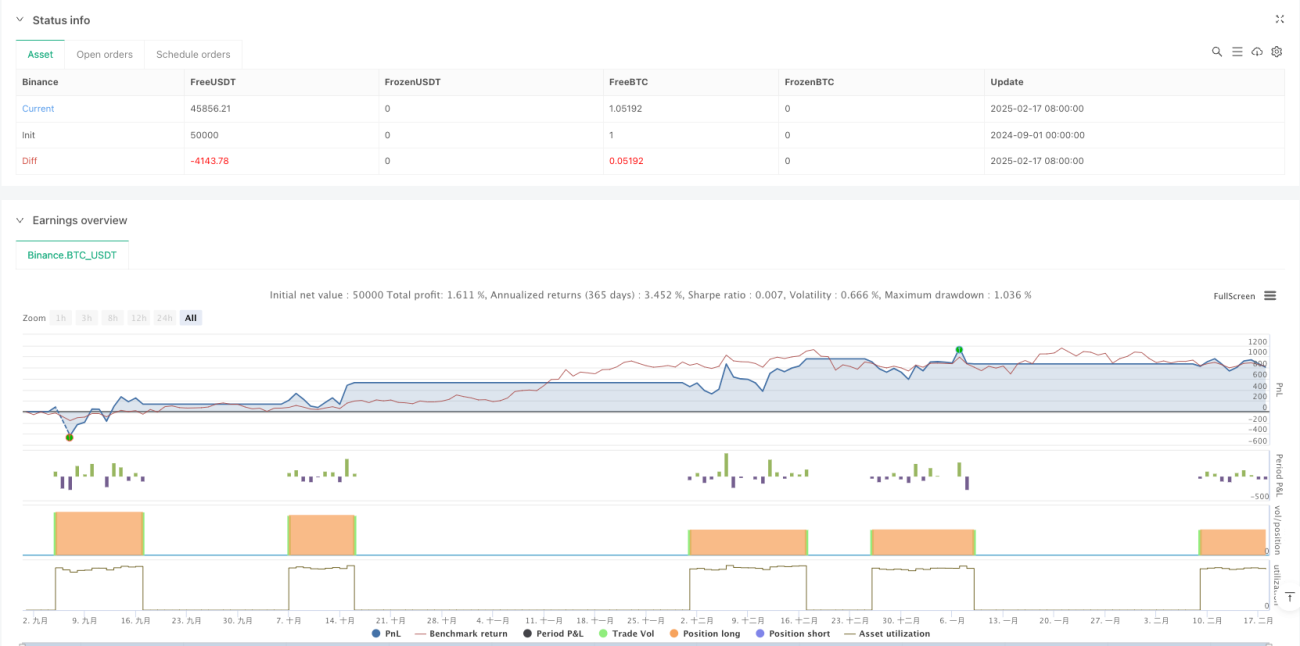
/*backtest
start: 2024-09-01 00:00:00
end: 2025-02-18 08:00:00
period: 1d
basePeriod: 1d
exchanges: [{"eid":"Binance","currency":"BTC_USDT"}]
*/

//@version=6
strategy(title="SRSI + MACD Strategy with Dynamic Stop-Loss and Take-Profit", shorttitle="SRSI + MACD Strategy", overlay=false, default_qty_type=strategy.percent_of_equity, default_qty_value=10)

// User Inputs- 1