সুপারট্রেন্ড এনহ্যান্সড এনগাল্ফিং প্যাটার্ন ডায়নামিক রিস্ক কন্ট্রোল স্ট্র্যাটেজি

ওভারভিউ
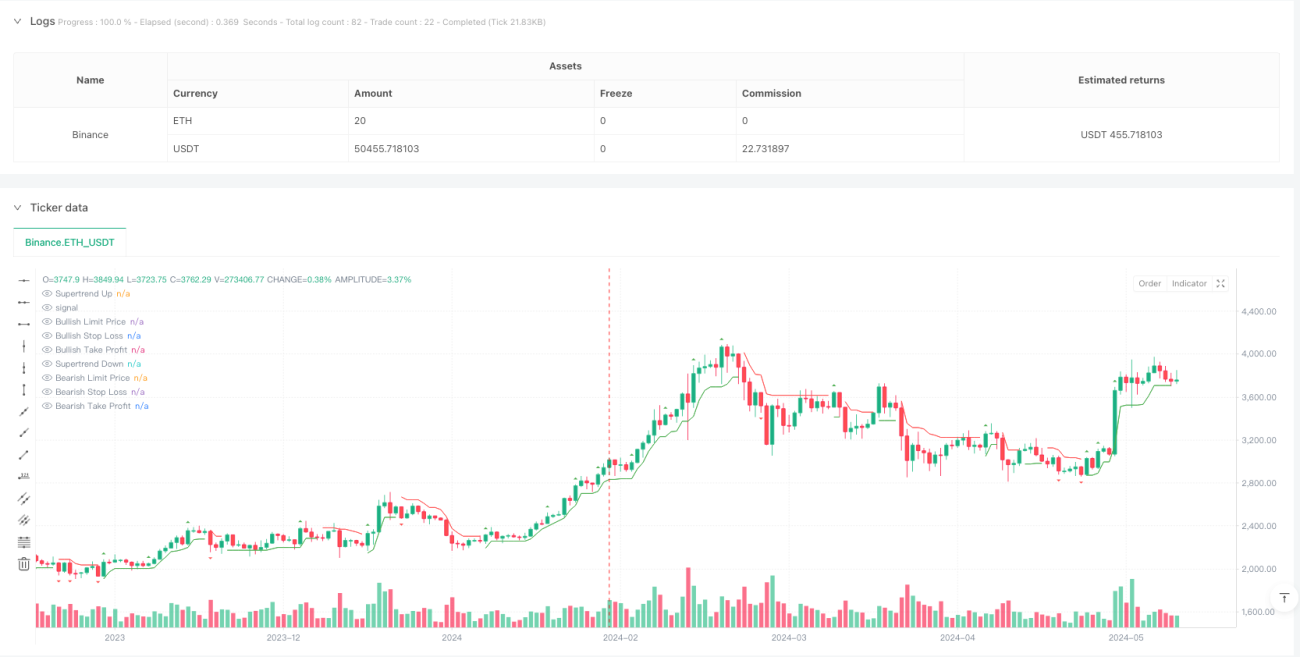
এটি একটি উচ্চমানের ট্রেডিং কৌশল যা সুপারট্রেন্ড সূচক এবং গ্রাসকারী মোডের সাথে মিলিত। কৌশলটি বাজারে গ্রাসকারী মোডের স্ক্র্যাপিং প্যাটার্নগুলি সনাক্ত করে এবং সুপারট্রেন্ড সূচকের সাথে মিলিত ট্রেন্ডের দিকনির্দেশ নিশ্চিত করে, সঠিক ট্রেডিং সিগন্যাল ফিল্টারিংয়ের জন্য। কৌশলটি গতিশীল স্টপ-অফ এবং লাভের সেটিংসকে সংহত করে, ঝুঁকি কার্যকরভাবে নিয়ন্ত্রণ করে এবং একই সাথে লাভের গ্যারান্টি দেয়।
কৌশল নীতি
এই কৌশলটি মূলত নিম্নলিখিত মূল নীতির উপর ভিত্তি করে তৈরি করা হয়েছেঃ
- সুপারট্রেন্ড সূচকটি গণনা করা হয় এটিআর (এভারেজ রিয়েল ওয়েভ এন্ডেজ) ব্যবহার করে, যা সামগ্রিক বাজার প্রবণতা নির্ধারণের জন্য ব্যবহৃত হয়।
- Boring Candle Threshold এবং Engulfing Candle Threshold সেট করে কার্যকর গ্রাসের ধরনগুলিকে ফিল্টার করুন।
- সুপারট্রেন্ড ট্রেন্ডের দিকটি গ্রাসকারী রূপের দিকের সাথে সামঞ্জস্যপূর্ণ হলেই পজিশনটি খুলুন।
- পজিশন খোলার মূল্যের উপর ভিত্তি করে গতিশীল স্টপ-ডাউন এবং বেনিফিট পজিশন সেটআপের উপর ভিত্তি করে।
- কৌশলগত পজিশন ম্যানেজমেন্ট ব্যবহার করে, নিশ্চিত করুন যে আপনি একই সময়ে শুধুমাত্র একটি ট্রেডিং দিক আছে।
কৌশলগত সুবিধা
- সিগন্যালের গুণমান কঠোরভাবে নিয়ন্ত্রিত হয় এবং ডাবল কনফার্মেশন ((ট্রেন্ড + মোড) এর মাধ্যমে নির্ভুলতা বৃদ্ধি পায়।
- বোরিং এবং গ্রাসিং থ্রেশহোল্ডের ধারণার প্রবর্তন, যা মিথ্যা সংকেতগুলিকে কার্যকরভাবে ফিল্টার করে।
- এটিআর-ভিত্তিক গতিশীল সুপারট্রেন্ড গণনা কৌশলটিকে ভাল বাজার অভিযোজনযোগ্য করে তোলে।
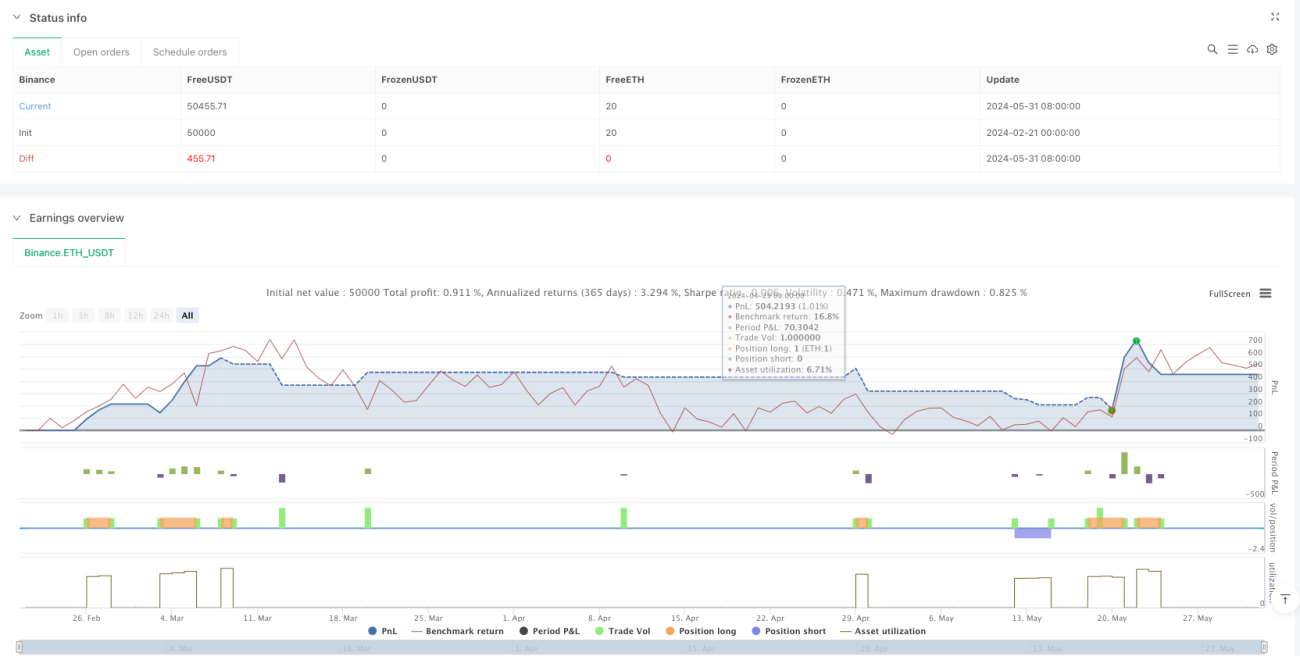
- একটি ভাল স্টপ লস এবং রিটার্ন ম্যানেজমেন্ট সিস্টেম যা ঝুঁকি নিয়ন্ত্রণ করে এবং মুনাফা লক করে।
- ট্রেডিং সিগন্যাল, স্টপ লস পয়েন্ট এবং মুনাফা অর্জনের টার্গেট স্পষ্টভাবে দৃশ্যমান।
কৌশলগত ঝুঁকি
- বাজারের অস্থিরতার মধ্যে প্রায়শই ভুয়া ব্রেকিং সিগন্যাল দেখা যায়।
- স্থির স্টপ লস এবং লাভের সেটিং সব বাজার পরিস্থিতির জন্য উপযুক্ত নাও হতে পারে।
- ট্রেন্ডের বিপরীতমুখী প্রবণতা একটি বড় বিপর্যয় সৃষ্টি করতে পারে।
- প্যারামিটার সেটিং সংবেদনশীল, এবং ভুল প্যারামিটারগুলি দুর্বল কর্মক্ষমতা সৃষ্টি করতে পারে।
- কম তরলতাপূর্ণ বাজারে, একটি স্লাইড পয়েন্টের ঝুঁকি থাকতে পারে।
কৌশল অপ্টিমাইজেশনের দিকনির্দেশনা
- সিগন্যাল নিশ্চিতকরণের জন্য ট্র্যাফিক সূচকগুলি চালু করা যেতে পারে।
- এটিআর-এর গুণিতক নিয়ন্ত্রন পদ্ধতিতে গতিশীলতা যোগ করার কথা বিবেচনা করুন।
- বাজারের অস্থিরতার উপর ভিত্তি করে স্টপ লস এবং লাভের অনুপাতের পরিবর্তনশীল সমন্বয়।
- সময় ফিল্টার যুক্ত করুন যাতে অপ্রয়োজনীয় সময়ে লেনদেন না হয়।
- ট্রেডিং এর গুণগত মান উন্নত করতে ট্রেডিং স্ট্রেনথ ফিল্টার যুক্ত করার কথা ভাবুন।
সারসংক্ষেপ
এটি একটি কঠোর, যুক্তিসঙ্গতভাবে সুস্পষ্ট কৌশল যা প্রযুক্তিগত সূচক এবং মোডাল বিশ্লেষণের সাথে মিলিত হয়ে ভাল সংকেত মানের নিয়ন্ত্রণ অর্জন করে। কৌশলটির ঝুঁকি ব্যবস্থাপনা ব্যবস্থাটি উন্নত, দৃশ্যমান প্রভাবটি দুর্দান্ত, রিয়েল-টাইম পরীক্ষার এবং অপ্টিমাইজেশনের জন্য উপযুক্ত। ব্যবসায়ীদের বাস্তব প্রয়োগে প্যারামিটার অপ্টিমাইজেশন এবং বাজার পরিবেশের নির্বাচনের দিকে মনোযোগ দেওয়ার পরামর্শ দেওয়া হয়।
- 1