
ওভারভিউ
এই কৌশলটি একাধিক প্রযুক্তিগত সূচকগুলির সাথে একত্রিত একটি পরিমাণগত ট্রেডিং সিস্টেম, যা তিনটি ক্লাসিক প্রযুক্তিগত সূচকগুলির সমন্বয় করে একটি সম্পূর্ণ ট্রেডিং সিগন্যাল সিস্টেম তৈরি করে। কৌশলটি ট্রেডিংয়ের দিকনির্দেশনা নিশ্চিত করার সময় ট্রেডিংয়ের গতিশীলতা সনাক্তকরণের সাথে প্রবণতা ট্র্যাকিংয়ের সমন্বয় করে। একই সাথে স্টপ লস, স্টপ লস এবং স্টপ লস ট্র্যাকিংয়ের মতো ঝুঁকি নিয়ন্ত্রণ ব্যবস্থাকে একীভূত করে একটি পদ্ধতিগত ট্রেডিং কৌশল গঠন করে।
কৌশল নীতি
কৌশলটি মূলত নিম্নলিখিত তিনটি স্তরের উপর ভিত্তি করে ট্রেডিং সিগন্যাল তৈরি করেঃ
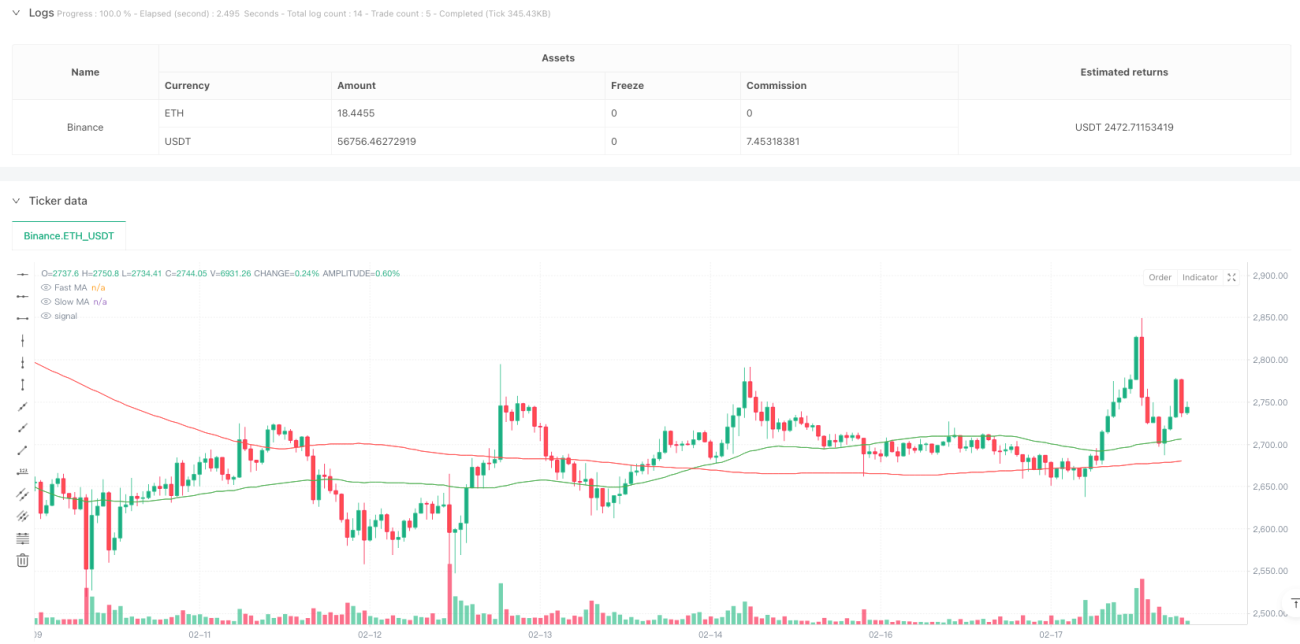
- প্রবণতা নির্ণয়ঃ 50 দিন এবং 200 দিন ডাবল সমান্তরাল সিস্টেম ব্যবহার করে, গোল্ডেন ফর্কের মাধ্যমে বড় প্রবণতার দিক নির্ণয় করা
- গতিশীলতা নিশ্চিতকরণঃ RSI ওভার-বই ওভার-বিক্রয় স্তর ((70/30) এবং MACD গোল্ডেন ফর্কের সাথে মিলিত, দামের গতিশীলতা যাচাই করে
- ঝুঁকি নিয়ন্ত্রণঃ 2% স্টপ লস, 4% স্টপ স্টপ এবং 1% ট্র্যাকিং স্টপ লস, একটি সম্পূর্ণ ঝুঁকি ব্যবস্থাপনা সিস্টেম তৈরি করুন
বিশেষত, যখন দ্রুত গড় লাইন (৫০ দিন) ধীর গড় লাইন (২০০ দিন) অতিক্রম করে, তখন একটি গোল্ড ফর্ক তৈরি হয়, আরএসআই ওভারবয়ে লেভেল না পৌঁছায় এবং ম্যাকড গোল্ড ফর্ক গঠন করে। বিপরীতভাবে, যখন একটি ডেড ফর্ক আসে এবং আরএসআই ওভারসোল লেভেল না পৌঁছায়, ম্যাকড ডেড ফর্ক গঠন করে, তখন সিস্টেমটি একটি শূন্যতা তৈরি করে।
কৌশলগত সুবিধা
- সিগন্যাল নির্ভরযোগ্যতাঃ একাধিক সূচক ক্রস যাচাইকরণের মাধ্যমে কার্যকরভাবে মিথ্যা সংকেতগুলি ফিল্টার করা যায়
- প্রবণতা সঠিকভাবে ধরুনঃ ক্লাসিক ডাবল-ইউনিভার্সারি সিস্টেম ব্যবহার করে প্রধান প্রবণতা আরও ভালভাবে ধরা যায়
- নিখুঁত ঝুঁকি নিয়ন্ত্রণঃ একাধিক ক্ষতির পদ্ধতির সমন্বিত ব্যবহার, কার্যকরভাবে নিচের ঝুঁকি নিয়ন্ত্রণ করে
- অভিযোজনযোগ্যতাঃ কৌশলগত প্যারামিটারগুলি বিভিন্ন বাজারের অবস্থার সাথে খাপ খাইয়ে নিতে সক্ষম
- স্পষ্টতা সম্পাদন করুনঃ সংকেত উত্পাদনের শর্তগুলি স্পষ্ট, বিষয়গত বিচারের দ্বারা আনা ব্যাঘাত এড়ানো
কৌশলগত ঝুঁকি
- পিছিয়ে পড়ার ঝুঁকি: মুভিং এভারেজ নিজেই পিছিয়ে আছে এবং সেরা প্রবেশের সুযোগ মিস করতে পারে
- অস্থির বাজার ঝুঁকিঃ অস্থির বাজারগুলির মধ্যে, মিথ্যা ব্রেকিং সিগন্যালগুলি প্রায়শই দেখা দিতে পারে
- প্যারামিটার অপ্টিমাইজেশনের ঝুঁকিঃ অতিরিক্ত অপ্টিমাইজেশান প্যারামিটারগুলি ওভারফিট হতে পারে, যা কৌশলটির স্থায়িত্বকে প্রভাবিত করে
- খরচ নিয়ন্ত্রণের ঝুঁকিঃ ঘন ঘন লেনদেনের ফলে লেনদেনের খরচ বেশি হতে পারে
- বাজার পরিবেশের উপর নির্ভরশীলতাঃ কৌশলগুলি প্রবণতাযুক্ত বাজারে ভাল কাজ করে, তবে অন্যান্য বাজারের পরিবেশের অধীনে কম কার্যকর হতে পারে
কৌশল অপ্টিমাইজেশনের দিকনির্দেশনা
- ট্রানজিট সূচক প্রবর্তনঃ বিদ্যমান সিগন্যাল সিস্টেমে ট্রানজিট নিশ্চিতকরণ এবং সিগন্যাল নির্ভরযোগ্যতা বৃদ্ধি
- অপ্টিমাইজেশান প্যারামিটার স্বনির্ধারণঃ প্যারামিটার গতিশীল সমন্বয় প্রক্রিয়া বিকাশ, বাজার অভিযোজনযোগ্যতা কৌশল উন্নত
- বাজার মনোভাবের সূচক বাড়ানোঃ ভিআইএক্সের মতো মনোভাবের সূচকগুলি প্রবর্তন করা, প্রবেশের সময়কে অনুকূল করা
- ক্ষতির ব্যবস্থাপনা উন্নত করাঃ এটিআর-ভিত্তিক গতিশীল ক্ষতির ব্যবস্থা যেমন আরও নমনীয় ক্ষতির ব্যবস্থা তৈরি করা
- অস্থিরতা ফিল্টার যুক্ত করুনঃ উচ্চ অস্থিরতার পরিবেশে পজিশনগুলি সামঞ্জস্য করুন, ঝুঁকি-লাভের অনুপাতটি অনুকূলিত করুন
সারসংক্ষেপ
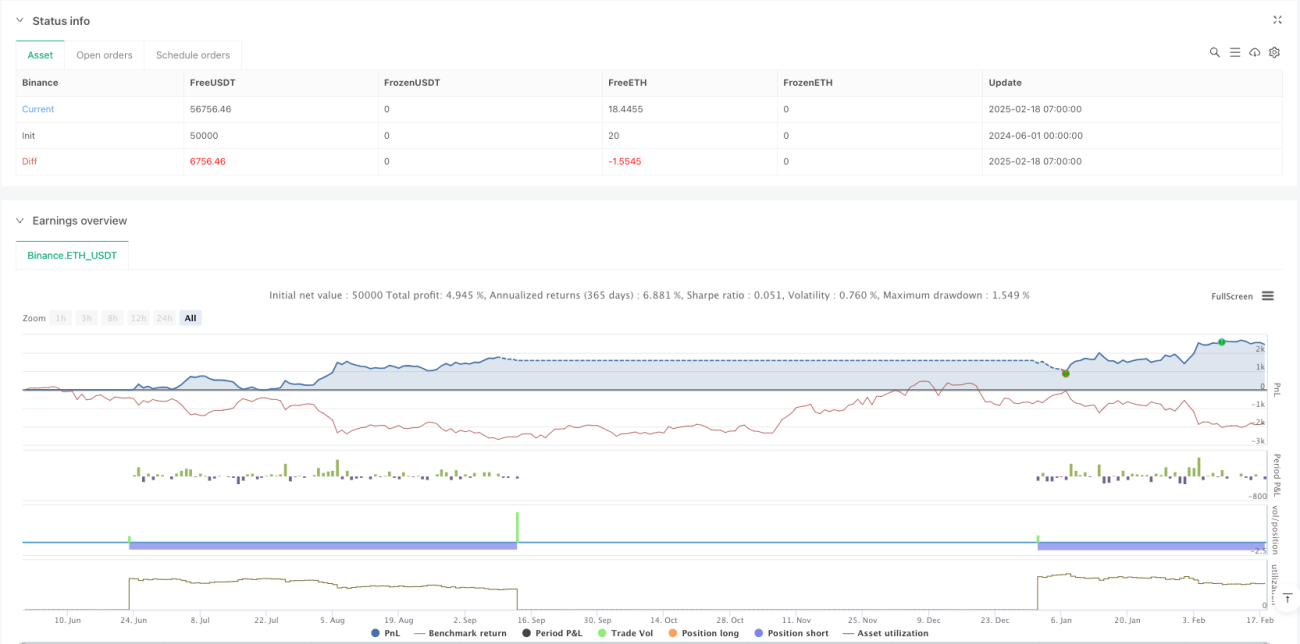
এই কৌশলটি একাধিক প্রযুক্তিগত সূচকের সমন্বয় করে একটি অপেক্ষাকৃত সম্পূর্ণ ট্রেডিং সিস্টেম তৈরি করে। কৌশলটি প্রবণতাযুক্ত বাজারে ভাল কাজ করে, তবে বাস্তব বাজারের পরিস্থিতি অনুসারে এখনও অনুকূলিতকরণের প্রয়োজন। ব্যবসায়ীদের পরামর্শ দেওয়া হয় যে তারা প্রথমে পর্যাপ্ত ফিডব্যাক যাচাই করে এবং তাদের নিজস্ব ঝুঁকি সহনশীলতার উপর ভিত্তি করে প্যারামিটার সেট করে। কৌশলটির মূল সুবিধাটি সিস্টেমাইজড সিগন্যাল জেনারেশন প্রক্রিয়া এবং একটি উন্নত ঝুঁকি নিয়ন্ত্রণ ব্যবস্থায় রয়েছে, যা এটির ভাল বাস্তব যুদ্ধের প্রয়োগের মূল্য দেয়।
- 1