ফিবোনাচ্চি রিট্রেসমেন্ট এবং স্টপ-প্রফিট এবং স্টপ-লস অপ্টিমাইজেশন সিস্টেমের সাথে মিলিত মাল্টি-ইন্ডিকেটর ক্রস ট্রেন্ড ট্র্যাকিং কৌশল

ওভারভিউ
এই কৌশলটি একটি সমন্বিত ট্রেডিং সিস্টেম যা সূচকীয় মুভিং এভারেজ (ইএমএ) ক্রস, ফিবোনাচি রিডাকশন স্তর, প্রবণতা বিচার এবং স্টপ লস ম্যানেজমেন্টের সাথে মিলিত। কৌশলটি 9 চক্র এবং 21 চক্রের ইএমএর ক্রস দ্বারা ট্রেডিং সংকেত নির্ধারণ করে, যখন ফিবোনাচি রিডাকশন স্তরের সাথে মিলিত হয় প্রবেশের পয়েন্ট পয়েন্টটি অপ্টিমাইজ করার জন্য এবং রিয়েল-টাইম ট্রেন্ড স্ট্যাটাস মনিটরিংয়ের মাধ্যমে ব্যবসায়ের নির্ভুলতা বাড়ানোর জন্য। সিস্টেমটি শতাংশ স্টপ লস ম্যানেজমেন্টও সংহত করে, যা কার্যকরভাবে ঝুঁকি নিয়ন্ত্রণ করে।
কৌশল নীতি
কৌশলটির মূল যুক্তি নিম্নলিখিত মূল উপাদানগুলির উপর ভিত্তি করে:
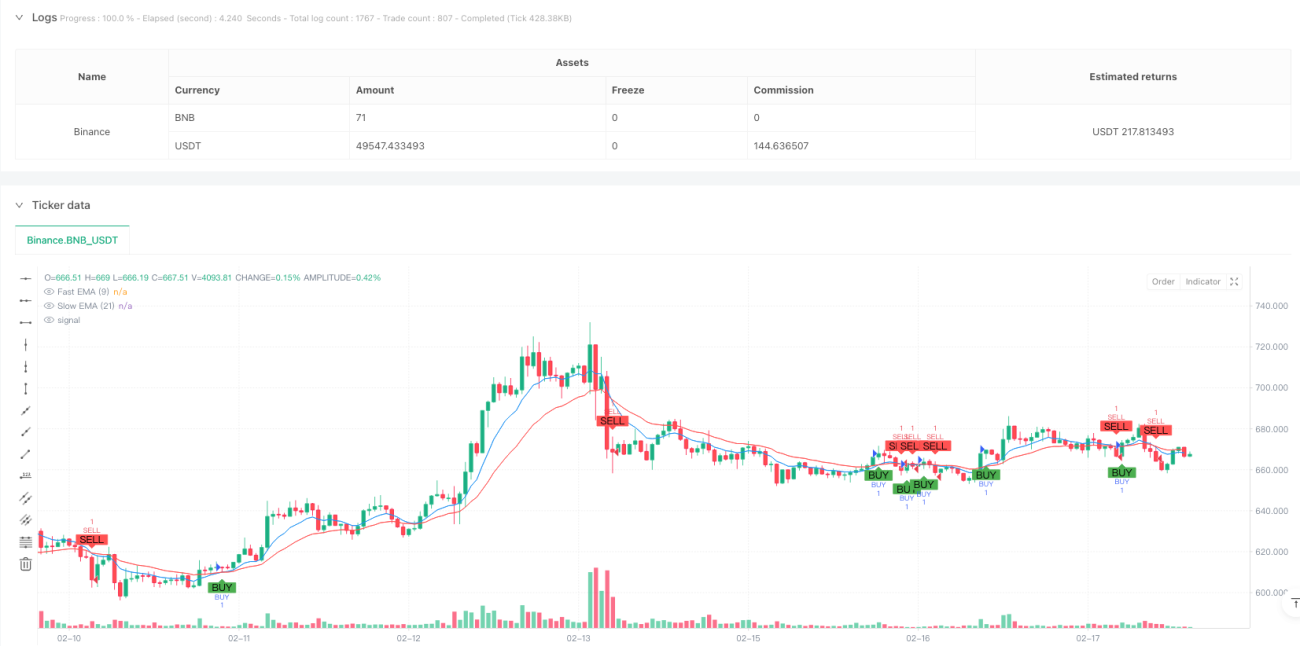
- যখন দ্রুত EMA ((9 চক্র) ধীর EMA ((21 চক্র) অতিক্রম করে তখন সিস্টেমটি একটি মাল্টিসিগন্যাল তৈরি করে
- যখন দ্রুত ইএমএ নীচে ধীর ইএমএ অতিক্রম করে, সিস্টেমটি একটি ফাঁকা সংকেত তৈরি করে
- ১০০টি চক্রের সর্বোচ্চ এবং সর্বনিম্ন মূল্য গণনা করে ২৩.৬%, ৩৮.২%, ৫০% এবং ৬১.৮% এর ফিবোনাচি রিডাকশন স্তর আঁকা হয়েছে
- বর্তমান প্রবণতা স্থিতির বিচার করা যায় ফাস্ট ইএমএর অবস্থান এবং ক্লোজিং প্রাইসের মধ্যে সম্পর্ক দিয়ে
- লেনদেনের সময়, সিস্টেমটি স্বয়ংক্রিয়ভাবে স্টপ লেভেল (%) এবং স্টপ লস (%) সেট করে।
কৌশলগত সুবিধা
- মাল্টি-ডাইমেনশনাল সিগন্যাল কনফার্মেশনঃ ইএমএ ক্রস, ফিবোনাচি স্তর এবং ট্রেন্ডের অবস্থা সহ আরও নির্ভরযোগ্য ট্রেডিং সিগন্যাল সরবরাহ করে
- ঝুঁকি ব্যবস্থাপনা উন্নতঃ পূর্বনির্ধারিত স্টপস্টপ ক্ষতির শতাংশের মাধ্যমে স্বয়ংক্রিয় ঝুঁকি নিয়ন্ত্রণ
- প্রবণতা ট্র্যাকিং ক্ষমতা শক্তিশালীঃ EMA ক্রস প্রবণতা অবস্থা বিচার, কার্যকরভাবে বাজারের প্রবণতা ক্যাপচার করতে পারে
- স্পষ্ট ভিজ্যুয়াল ফিডব্যাকঃ ট্রেডিং সিদ্ধান্তে সহায়তা করার জন্য ট্যাগগুলি মূল মূল্য স্তর, প্রবণতা অবস্থা এবং ট্রেডিং সংকেতগুলি প্রদর্শন করে
- উচ্চ স্তরের পদ্ধতিগতকরণঃ লেনদেনের লজিক স্পষ্ট, স্বতন্ত্র বিচার দ্বারা প্রভাবিত হয় না
কৌশলগত ঝুঁকি
- বাজারের ঝুঁকিঃ ঘন ঘন EMA-র ক্রসিংয়ের ফলে ভুল সংকেত হতে পারে
- পিছিয়ে পড়ার ঝুঁকিঃ চলমান গড়গুলি মূলত পিছিয়ে পড়া সূচক, যা সেরা সময়টি মিস করতে পারে
- স্থির ক্ষতির ঝুঁকিঃ পূর্বনির্ধারিত স্থির শতাংশ ক্ষতির ঝুঁকি সমস্ত বাজার পরিস্থিতিতে উপযুক্ত নাও হতে পারে
- সিগন্যাল দ্বন্দ্বের ঝুঁকিঃ একাধিক সূচকের মধ্যে দ্বন্দ্বের সংকেত থাকতে পারে, সিদ্ধান্ত গ্রহণের অসুবিধা বাড়ায়
- বাজারের অস্থিরতার ঝুঁকিঃ তীব্র অস্থিরতার কারণে স্টপ পয়েন্ট অযৌক্তিক হতে পারে
কৌশল অপ্টিমাইজেশনের দিকনির্দেশনা
- ডায়নামিক স্টপ অপ্টিমাইজেশানঃ এটিআর বা বাজার ওঠানামার উপর ভিত্তি করে স্টপ দূরত্বের গতিশীলতা
- সংকেত পরিস্রাবণ বাড়ানোঃ ভুয়া সংকেত পরিস্রাবণ করার জন্য ট্র্যাফিক ভলিউম, গতির মতো সহায়ক সূচকগুলি বাড়ানো
- প্যারামিটার স্বনির্ধারণঃ একটি স্বনির্ধারণ ব্যবস্থা চালু করা, বাজারের অবস্থার গতিশীলতা অনুসারে ইএমএ চক্রটি সামঞ্জস্য করা
- এন্ট্রি অপ্টিমাইজেশানঃ দামের আকৃতি এবং লেনদেনের পরিমাণের সাথে মিলিত ফিবোনাচি স্তরের কাছাকাছি এন্ট্রি অপ্টিমাইজেশন
- পজিশন ম্যানেজমেন্ট উন্নতঃ অস্থিরতা এবং অ্যাকাউন্ট ঝুঁকি উপর ভিত্তি করে ডিজাইন গতিশীল পজিশন ম্যানেজমেন্ট সিস্টেম
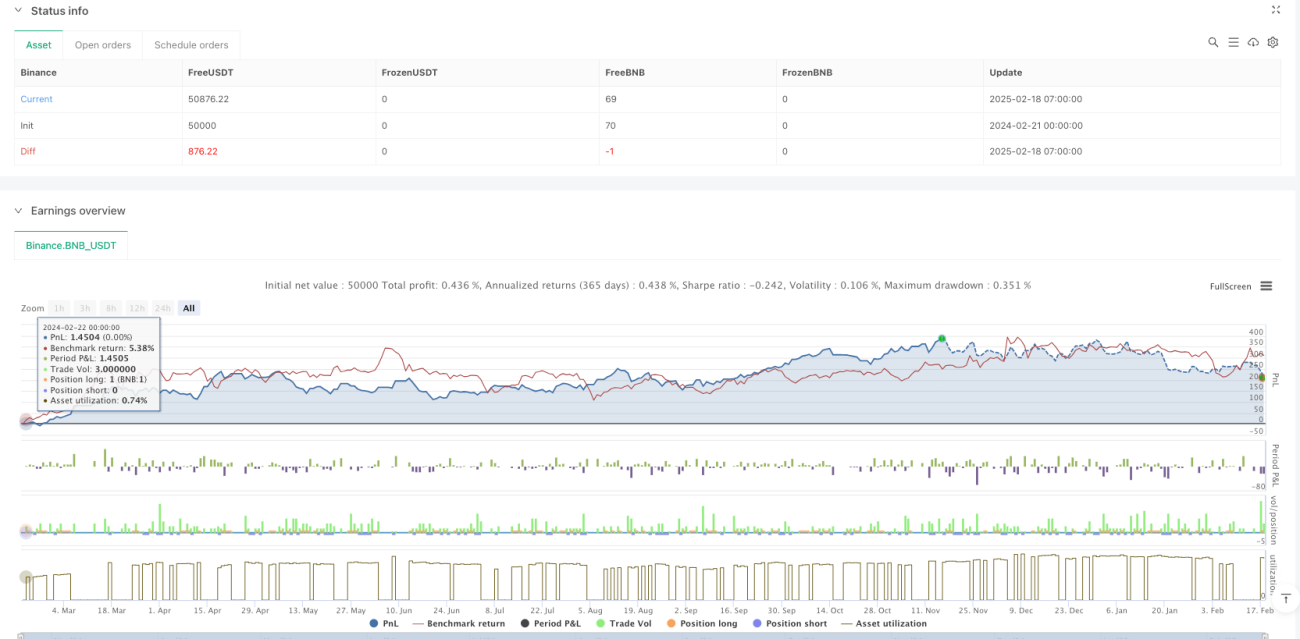
সারসংক্ষেপ
এই কৌশলটি বেশ কয়েকটি ক্লাসিক প্রযুক্তিগত বিশ্লেষণের সরঞ্জামকে একত্রিত করে একটি সম্পূর্ণ ট্রেডিং সিস্টেম তৈরি করে। এর সুবিধা হল সিগন্যাল স্বীকৃতির বহু মাত্রিকতা এবং ঝুঁকি পরিচালনার পদ্ধতিগতকরণ, তবে এখনও বিভিন্ন বাজার পরিবেশের জন্য অপ্টিমাইজেশন প্রয়োজন। ব্যবসায়ীদের পরামর্শ দেওয়া হয় যে তারা বাজারের নির্দিষ্ট পরিস্থিতির সাথে মিলিত প্যারামিটারগুলির জন্য অনুকূলিতকরণ করতে পারে এবং সর্বদা ঝুঁকি সম্পর্কে সতর্ক থাকতে পারে।
- 1