
ওভারভিউ
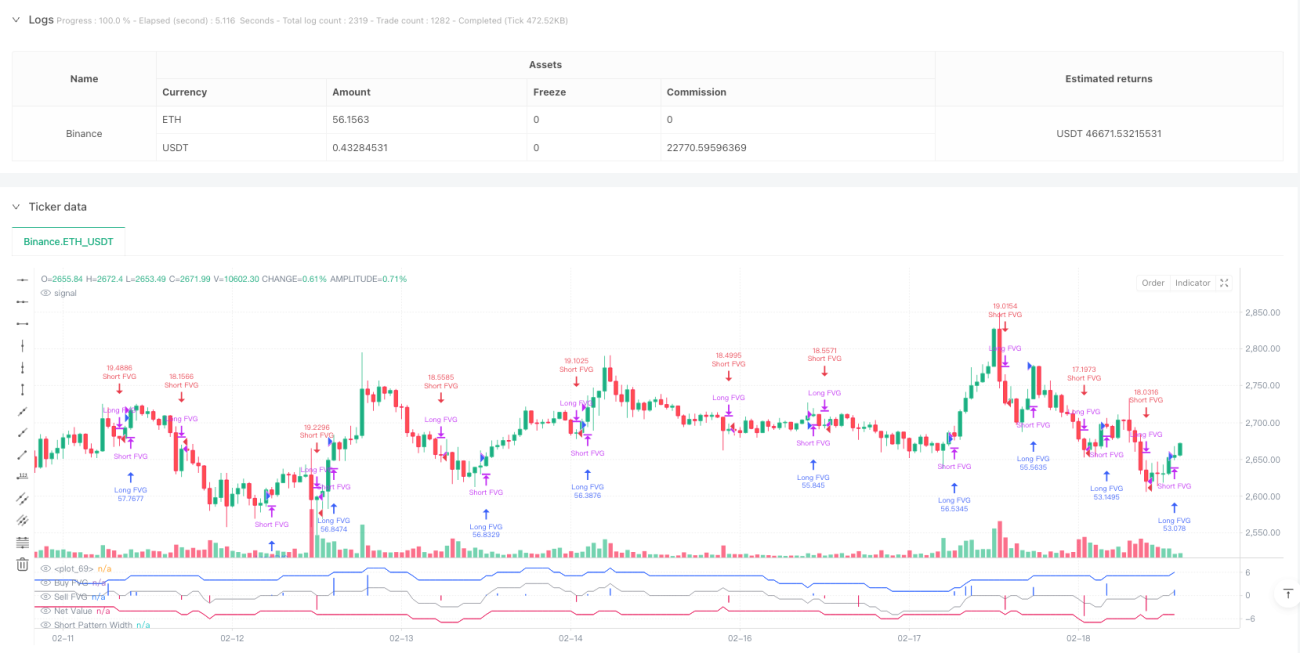
এই কৌশলটি একটি উদ্ভাবনী ট্রেডিং সিস্টেম যা ফেয়ার ভ্যালু গ্যাপ (FVG) এর উপর ভিত্তি করে এবং বাজারে মূল্যের ফাঁক এবং লেনদেনের পরিমাণের অস্বাভাবিকতা সনাক্ত করে সম্ভাব্য ব্যবসায়ের সুযোগগুলি ধরার জন্য। এই কৌশলটি গতিশীল গণনা প্রক্রিয়া এবং একীভূতকরণ প্রক্রিয়াজাতকরণের সাথে একত্রিত হয়েছে, যা কেবলমাত্র ক্রয়-বিক্রয় সংকেতগুলিকে সঠিকভাবে সনাক্ত করতে সক্ষম নয়, তবে ব্যবসায়ীদের বাজারের কাঠামোটি আরও ভালভাবে বুঝতে সহায়তা করার জন্য এটির ভিজ্যুয়াল উপস্থাপনা করে।
কৌশল নীতি
কৌশলটির মূল বিষয় হল ক্রমাগত K লাইনের মধ্যে মূল্যের ফাঁকগুলি পর্যবেক্ষণ করে সম্ভাব্য লেনদেনের সুযোগগুলি চিহ্নিত করা।
- বহু-প্রান্তিক FVG (BFVG) গঠনের শর্ত হল বর্তমান K লাইনের সর্বনিম্ন মূল্য দুটি K লাইনের পূর্বের সর্বোচ্চ মূল্যের চেয়ে বেশি
- খালি FVG (SFVG) গঠনের শর্ত হল বর্তমান K লাইনের সর্বোচ্চ মূল্য দুটি K লাইনের আগে সর্বনিম্ন মূল্যের চেয়ে কম
- কৌশলটি লেনদেনের পরিমাণ এবং ফাঁক আকারের উপর ভিত্তি করে একটি যাচাইকরণ ব্যবস্থা প্রবর্তন করে, কেবলমাত্র যাচাইকরণের শর্ত পূরণ করে এমন এফভিজিই ট্রেডিং সিগন্যাল ট্রিগার করে
- একটি 50 চক্রের গতিশীল গণনা উইন্ডো ব্যবহার করে অতিরিক্ত এফভিজি গণনা করুন
- হোল্ড প্রস্থকে আরও স্বজ্ঞাত পরিমাপ মান হিসাবে রূপান্তর করুন
কৌশলগত সুবিধা
- সিস্টেমটি একটি উন্নত সংকেত যাচাইকরণ ব্যবস্থা রয়েছে যা ট্র্যাফিক এবং ফাঁক প্রস্থের দ্বৈত নিশ্চিতকরণের মাধ্যমে সংকেত মান উন্নত করে
- ডায়নামিক কাউন্টার উইন্ডো কার্যকরভাবে বাজারের প্রবণতা পরিবর্তন ক্যাপচার করতে পারে
- একীকরণ প্রক্রিয়া বিভিন্ন সময়ের সংকেতকে তুলনামূলক করে তোলে
- কৌশলটিতে স্বয়ংক্রিয়ভাবে পজিশন ম্যানেজমেন্ট বৈশিষ্ট্য রয়েছে যা নতুন পজিশন খোলার আগে স্বয়ংক্রিয়ভাবে বিপরীতমুখী পজিশনগুলিকে সমতল করে দেয়
- ট্রেডারদের বাজারের অবস্থা বুঝতে সাহায্য করার জন্য চমৎকার ভিজ্যুয়ালাইজেশন
কৌশলগত ঝুঁকি
- এফভিজি সংকেত উচ্চ অস্থিরতার বাজারে মিথ্যা সংকেত তৈরি করতে পারে
- নির্দিষ্ট যাচাইকরণ পরামিতিগুলি সমস্ত বাজার পরিবেশে প্রযোজ্য নাও হতে পারে
- কোন ক্ষতি এবং থামানোর ব্যবস্থা নেই, যার ফলে বড় আকারের প্রত্যাহার হতে পারে
- ঘন ঘন লেনদেনের ফলে লেনদেনের খরচ বাড়তে পারে
এই ঝুঁকিগুলিকে সঠিক স্টপ পজিশনের মাধ্যমে এবং মার্কেট এনভায়রনমেন্টাল ফিল্টার প্রবর্তনের মাধ্যমে পরিচালনা করার পরামর্শ দেওয়া হয়।
কৌশল অপ্টিমাইজেশনের দিকনির্দেশনা
- স্বনির্ধারিত প্যারামিটার সমন্বয় ব্যবস্থা চালু করা যাতে কৌশলগুলি বিভিন্ন বাজারের অবস্থার সাথে আরও ভালভাবে মানিয়ে নিতে পারে
- প্রবণতা ফিল্টার যুক্ত করুন, শক্তিশালী প্রবণতার সময় শুধুমাত্র একমুখী লেনদেন করুন
- ব্যাচ বিল্ডিং এবং ডায়নামিক স্টপ লস সহ আরও জটিল ওয়ারহাউস ম্যানেজমেন্ট সিস্টেম ডিজাইন করা
- লেনদেনের খরচ যোগ করুন, লেনদেনের ফ্রিকোয়েন্সি অপ্টিমাইজ করুন
- অন্যান্য প্রযুক্তিগত সূচকের সাথে সংযুক্ত করে সংকেতের নির্ভরযোগ্যতা বাড়ানো
সারসংক্ষেপ
এটি একটি মূল্য কাঠামোর উপর ভিত্তি করে একটি উদ্ভাবনী লেনদেন কৌশল, যা যুক্তিসঙ্গত মূল্যের ফাঁকগুলির বুদ্ধিমান সনাক্তকরণ এবং যাচাইয়ের মাধ্যমে বাজারের সুযোগগুলি ক্যাপচার করে। কৌশলটির নকশা ধারণা পরিষ্কার, বাস্তবায়নের পদ্ধতি পেশাদার, ভাল স্কেলযোগ্যতা রয়েছে। প্রস্তাবিত অপ্টিমাইজেশনের দিকনির্দেশের মাধ্যমে কৌশলটির স্থায়িত্ব এবং লাভজনকতা আরও বাড়ানোর সম্ভাবনা রয়েছে।
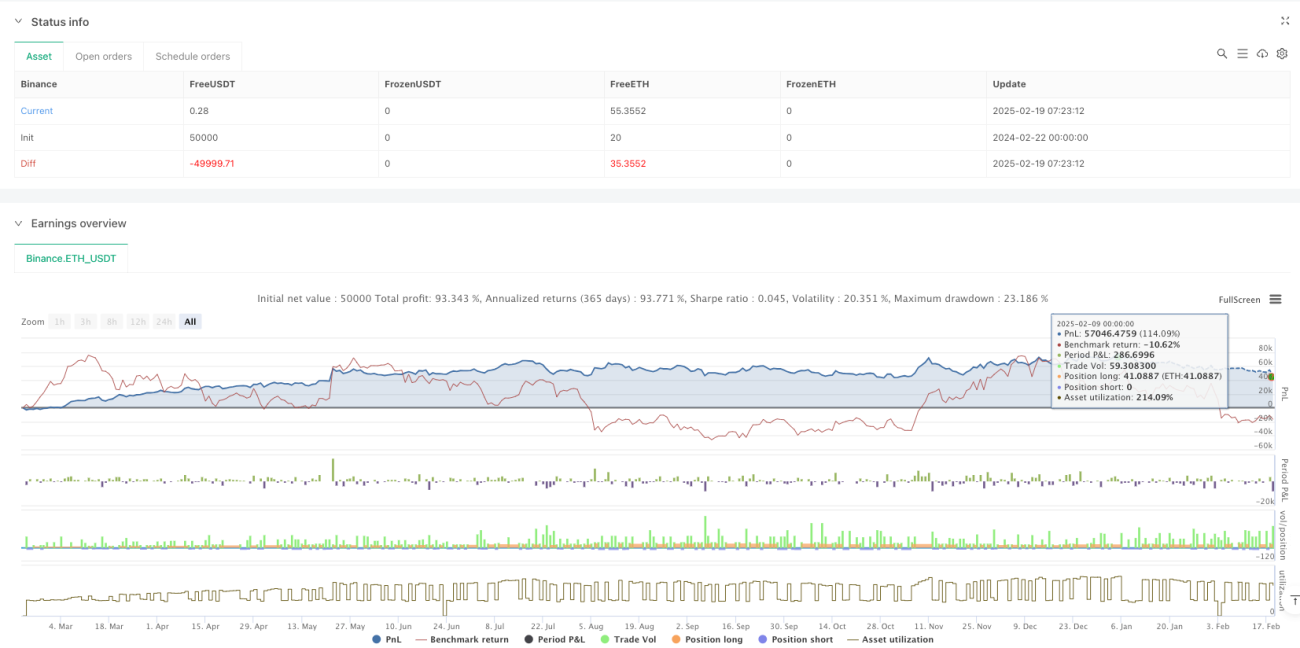
/*backtest
start: 2024-02-22 00:00:00
end: 2025-02-19 08:00:00
period: 1h
basePeriod: 1h
exchanges: [{"eid":"Binance","currency":"ETH_USDT"}]
*/

// ----------------------------------------------------------------------------
// This Pine Script™ code is subject to the terms of the Mozilla Public License
// 2.0 at https://mozilla.org/MPL/2.0/
// © OmegaTools- 1