
ওভারভিউ
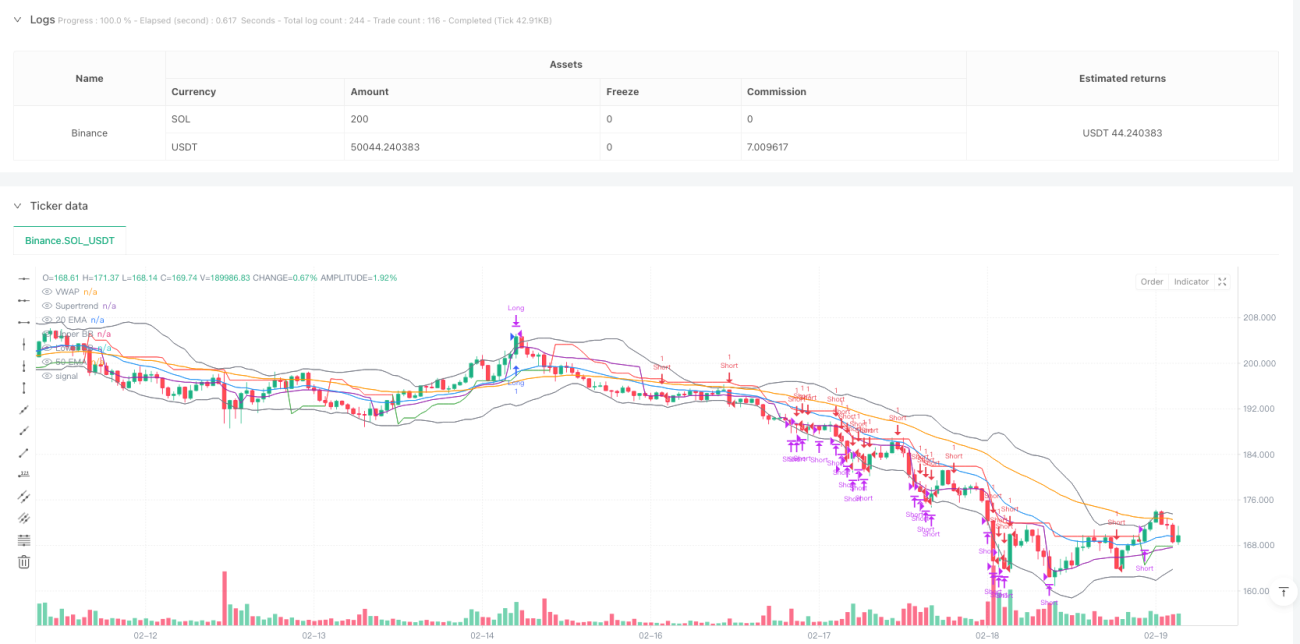
এই কৌশলটি একটি স্বনির্ধারিত ট্রেডিং সিস্টেম যা প্রবণতা ট্র্যাকিং এবং স্প্যান ট্রেডিংয়ের সাথে মিলিত। এটি একাধিক প্রযুক্তিগত সূচকগুলির সমন্বয় করে এবং বিভিন্ন বাজার পরিবেশে নমনীয়ভাবে ট্রেডিং মোডগুলিকে স্যুইচ করে। এই কৌশলটি সুপারট্রেন্ড, মোবাইল গড়, এডিএক্স, আরএসআই এবং ব্রিন ব্যান্ডের মতো সূচকগুলি ব্যবহার করে বাজার পরিস্থিতি সনাক্ত করতে এবং ট্রেডিং সংকেতগুলি নির্ধারণ করতে, যখন ভিডাব্লুএপি-র সাথে দামের রেফারেন্স করা হয়, এবং ঝুঁকি নিয়ন্ত্রণের জন্য একটি স্টপ লস সিস্টেম সেট করা হয়।
কৌশল নীতি
কৌশলটির মূল যুক্তি দুটি অংশে বিভক্তঃ প্রবণতা অনুসরণ এবং ব্যবধানের ব্যবসায়। প্রবণতা বাজারে (ADX> 25 দ্বারা নির্ধারিত), কৌশলটি সুপারট্রেন্ডের দিকনির্দেশনা, ইএমএ ক্রস এবং ভিডাব্লুএপি অবস্থানের উপর ভিত্তি করে সংকেত তৈরি করে। ঝাঁকুনির বাজারে, কৌশলটি বুলিন বন্ডের সীমানা এবং আরএসআই ওভারপয় ওভারসোল স্তর ব্যবহার করে লেনদেন করে।
- প্রবণতা ট্র্যাকিং মোডঃ যখন ADX> 25 চালু হয়, 20/50 চক্রের EMA এর অবস্থান সম্পর্কিত, সুপারট্রেন্ডের দিকনির্দেশ এবং দামের তুলনায় VWAP এর অবস্থান সমন্বিত বিচার
- ব্যাপ্তি ট্রেডিং মোডঃ যখন ADX <25 হয় তখন এটি চালু হয়, যখন দামগুলি ব্রিন বন্ডের সীমানা স্পর্শ করে এবং RSI চূড়ান্ত হয় তখন প্রবেশ করুন
- প্রস্থান শর্তগুলি অন্তর্ভুক্তঃ স্টপ লস ট্রিগার, সুপারট্রেন্ড বিপরীতমুখী বা আরএসআই চূড়ান্ত
কৌশলগত সুবিধা
- স্বনির্ধারিতঃ বাজারের অবস্থার উপর ভিত্তি করে স্বয়ংক্রিয়ভাবে ট্রেডিং মোডে স্যুইচ করতে সক্ষম
- একাধিক প্রমাণীকরণঃ একাধিক সূচক ব্যবহার করে ক্রস যাচাইকরণ, সংকেত নির্ভরযোগ্যতা বৃদ্ধি করে
- ঝুঁকি নিয়ন্ত্রণ উন্নতঃ স্থির শতাংশ স্টপ লস সেট করা হয়েছে এবং আরএসআই চরম মান ব্যবহার করে গতিশীলভাবে সামঞ্জস্য করা হয়েছে
- সামগ্রিকভাবে শক্তিশালীঃ প্রবণতা বোঝা এবং বাজারের অস্থিরতার মধ্যে লাভ করা
- ভিজ্যুয়ালাইজেশন সহায়তাঃ সিদ্ধান্তের বিশ্লেষণে সহায়তার জন্য গুরুত্বপূর্ণ সূচকগুলির গ্রাফিকাল উপস্থাপনা
কৌশলগত ঝুঁকি
- প্যারামিটার সংবেদনশীলতাঃ একাধিক সূচক প্যারামিটার সেটিং নীতি কর্মক্ষমতা প্রভাবিত করতে পারে
- সিগন্যাল পিছিয়ে: প্রযুক্তিগত সূচকগুলি নিজেই পিছিয়ে রয়েছে
- ভুয়া ব্রেকআউটের ঝুঁকিঃ ট্রান্সক্রিপ্ট মার্কেটে ভুয়া সংকেত সৃষ্টি হতে পারে
- গণনা জটিলতাঃ একাধিক সূচকের রিয়েল-টাইম গণনা কার্যকর কার্যকারিতার উপর প্রভাব ফেলতে পারে
- বাজার অভিযোজনযোগ্যতাঃ নির্দিষ্ট বাজার পরিস্থিতিতে খারাপ হতে পারে
কৌশল অপ্টিমাইজেশনের দিকনির্দেশনা
- গতিশীল প্যারামিটার সমন্বয়ঃ সূচক প্যারামিটারগুলি স্বয়ংক্রিয়ভাবে ওঠানামা অনুসারে সামঞ্জস্য করা যায়
- ট্র্যাফিক বিশ্লেষণের প্রবর্তনঃ সিগন্যালের কার্যকারিতা যাচাই করার জন্য ট্র্যাফিক পরিমাপক যুক্ত করা হয়েছে
- অপ্টিমাইজড স্টপ লসঃ এটিআর ডায়নামিক স্টপ লস ব্যবহার করা যেতে পারে
- সময় ফিল্টার যুক্ত করুনঃ অকার্যকর সময়গুলি এড়াতে ট্রেডিং সময় উইন্ডো যুক্ত করুন
- মার্কেট সেন্টিমেন্ট ইনডিকেটরঃ ভবিষ্যদ্বাণী সঠিকতা বাড়াতে মার্কেট সেন্টিমেন্ট ইনডিকেটর একীভূত করা
সারসংক্ষেপ
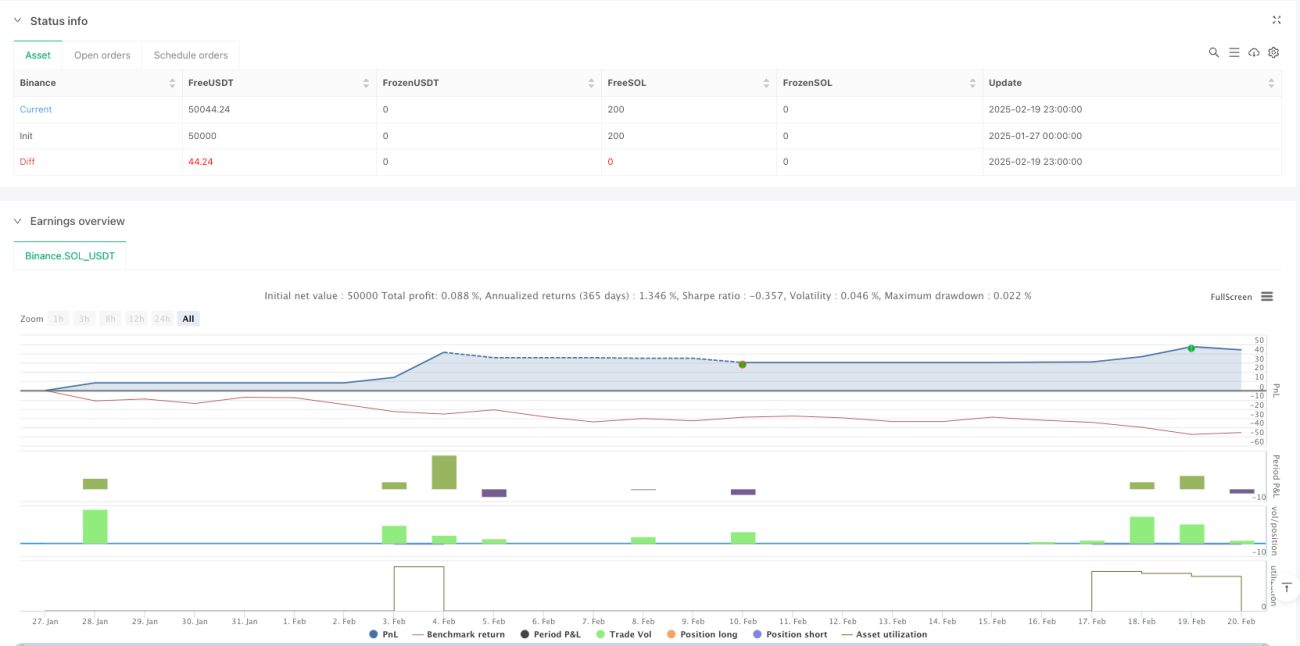
এটি একটি যুক্তিসঙ্গত, যুক্তিসঙ্গতভাবে পরিকল্পিত এবং সম্পূর্ণ সমন্বিত কৌশল। একাধিক সূচক সমন্বয় এবং মডেল স্যুইচিংয়ের মাধ্যমে বিভিন্ন বাজারের পরিবেশে কিছু অভিযোজনযোগ্যতা বজায় রাখা যায়। যদিও কিছু সম্ভাব্য ঝুঁকি রয়েছে, তবে যুক্তিসঙ্গত ঝুঁকি নিয়ন্ত্রণ এবং ক্রমাগত অপ্টিমাইজেশনের মাধ্যমে এই কৌশলটি ভাল রিয়েল-টাইম অ্যাপ্লিকেশন মান রয়েছে। রিয়েল-টাইম ব্যবহারের সময় পর্যাপ্ত প্যারামিটার অপ্টিমাইজেশন এবং পুনর্বিবেচনার পরামর্শ দেওয়া হয়।
- 1