বহু সূচক সমন্বিত অভিযোজিত ট্রেন্ড ট্রেডিং কৌশল

ওভারভিউ
এই কৌশলটি একটি অভিযোজিত ট্রেন্ড ফলোয়িং ট্রেডিং সিস্টেম যা একাধিক টেকনিক্যাল ইন্ডিকেটরকে একত্রিত করে। এটি মুভিং এভারেজ সিস্টেম (EMA), মোমেন্টাম ইন্ডিকেটর (RSI), ট্রেন্ড ইন্ডিকেটর (MACD) এবং সুপারট্রেন্ডকে সিগন্যাল নিশ্চিতকরণের জন্য ব্যবহার করে, এবং স্টপ-লস, টেক-প্রফিট ও ট্রেইলিং স্টপের মতো সম্পূর্ণ ঝুঁকি ব্যবস্থাপনা ব্যবস্থা অন্তর্ভুক্ত করে। কৌশলটি বাজারের অস্থিরতা বিবেচনায় নিয়ে ডিজাইন করা হয়েছে, একাধিক সিগন্যাল ফিল্টারিং ও ঝুঁকি নিয়ন্ত্রণের মাধ্যমে ট্রেডিংয়ের স্থিতিশীলতা ও নির্ভরযোগ্যতা বৃদ্ধি করে।
কৌশলের নীতি
কৌশলটি একাধিক স্তরের সিগন্যাল নিশ্চিতকরণ প্রক্রিয়া ব্যবহার করে:
- 9-পিরিয়ড ও 21-পিরিয়ড EMA-এর ক্রসওভারের মাধ্যমে প্রাথমিক ট্রেন্ড দিক নির্ধারণ
- RSI (14) ব্যবহার করে ওভারবট/ওভারসোল্ড ফিল্টারিং; ক্রয় সংকেতের জন্য RSI > 40 ও < 70 প্রয়োজন, বিক্রয় সংকেতের জন্য RSI < 60 ও > 30 প্রয়োজন
- MACD ইন্ডিকেটর ট্রেন্ড মোমেন্টাম যাচাই করে, সিগন্যাল লাইন ও MACD লাইনের দিক একই হতে হবে
- সুপারট্রেন্ড ইন্ডিকেটর অতিরিক্ত ট্রেন্ড নিশ্চিতকরণ প্রদান করে
- ঝুঁকি নিয়ন্ত্রণে ৫% স্টপ-লস, ১০% টেক-প্রফিট, ২% ট্রেইলিং স্টপ ও ১% ব্রেক-ইভেন পয়েন্ট ব্যবহার করা হয়
সমস্ত শর্ত একসাথে পূরণ হলেই ট্রেড সিগন্যাল ট্রিগার হয়, যা মিথ্যা ব্রেকআউটের ঝুঁকি কার্যকরভাবে হ্রাস করে।
কৌশলের সুবিধা
- একাধিক সিগন্যাল নিশ্চিতকরণ প্রক্রিয়া মিথ্যা সিগন্যালের হস্তক্ষেপ উল্লেখযোগ্যভাবে হ্রাস করে
- সম্পূর্ণ ঝুঁকি নিয়ন্ত্রণ ব্যবস্থা, যাতে নির্দিষ্ট স্টপ-লস, ট্রেইলিং স্টপ ও ব্রেক-ইভেন স্টপ অন্তর্ভুক্ত
- কৌশলটির ভালো অভিযোজন ক্ষমতা রয়েছে, বিভিন্ন বাজার পরিবেশের সাথে খাপ খাইয়ে নিতে পারে
- এন্ট্রি ও এক্সিট লজিক পরিষ্কার, বোঝা ও বজায় রাখা সহজ
- ট্রেডিং লজিকের একটি শক্ত তাত্ত্বিক ভিত্তি রয়েছে, প্রতিটি ইন্ডিকেটরের নির্দিষ্ট কার্যকারিতা আছে
কৌশলের ঝুঁকি
- একাধিক সিগন্যাল নিশ্চিতকরণ কিছু গুরুত্বপূর্ণ ট্রেড সুযোগ হারানোর কারণ হতে পারে
- তীব্র অস্থির বাজারে, নির্দিষ্ট স্টপ-লস পয়েন্ট যথেষ্ট নমনীয় নাও হতে পারে
- প্যারামিটার অপ্টিমাইজেশন ঐতিহাসিক ডেটার ওপর অতিরিক্ত ফিটিংয়ের কারণ হতে পারে
- একাধিক ইন্ডিকেটর সীমার বাজারে বিভ্রান্তিকর সিগন্যাল তৈরি করতে পারে
সমাধানের মধ্যে রয়েছে: স্টপ-লস প্যারামিটার গতিশীলভাবে সমন্বয় করা, অস্থিরতা ইন্ডিকেটর অন্তর্ভুক্ত করা, নিয়মিত প্যারামিটার পুনরায় অপ্টিমাইজ করা ইত্যাদি।
কৌশল অপ্টিমাইজেশনের দিকনির্দেশনা
- অভিযোজিত প্যারামিটার প্রক্রিয়া চালু করা, বাজারের অস্থিরতা অনুযায়ী বিভিন্ন প্যারামিটার গতিশীলভাবে সমন্বয় করা
- সহায়ক নিশ্চিতকরণ সরঞ্জাম হিসেবে ভলিউম ইন্ডিকেটর যুক্ত করা
- স্টপ-লস প্রক্রিয়া অপ্টিমাইজ করা, ATR-ভিত্তিক গতিশীল স্টপ-লস চালু করা
- বাজার পরিবেশ শনাক্তকরণ মডিউল যুক্ত করা, বিভিন্ন বাজার পরিস্থিতিতে ভিন্ন প্যারামিটার কম্বিনেশন ব্যবহার করা
- মেশিন লার্নিং-ভিত্তিক প্যারামিটার অপ্টিমাইজেশন সিস্টেম তৈরি করা
সারসংক্ষেপ
এই কৌশলটি বহুমাত্রিক টেকনিক্যাল ইন্ডিকেটরের সমন্বিত সহযোগিতার মাধ্যমে একটি শক্ত ট্রেডিং সিস্টেম তৈরি করেছে। সম্পূর্ণ ঝুঁকি নিয়ন্ত্রণ প্রক্রিয়া ও পরিষ্কার ট্রেডিং লজিক একে ভালো ব্যবহারযোগ্যতা দিয়েছে। যদিও কিছু অপ্টিমাইজেশনের সুযোগ রয়েছে, কৌশলটির মৌলিক কাঠামোর একটি শক্ত তাত্ত্বিক ভিত্তি আছে, এবং ক্রমাগত অপ্টিমাইজেশন ও উন্নতির মাধ্যমে এর ট্রেডিং কার্যকারিতা আরও বৃদ্ধি করা সম্ভব।
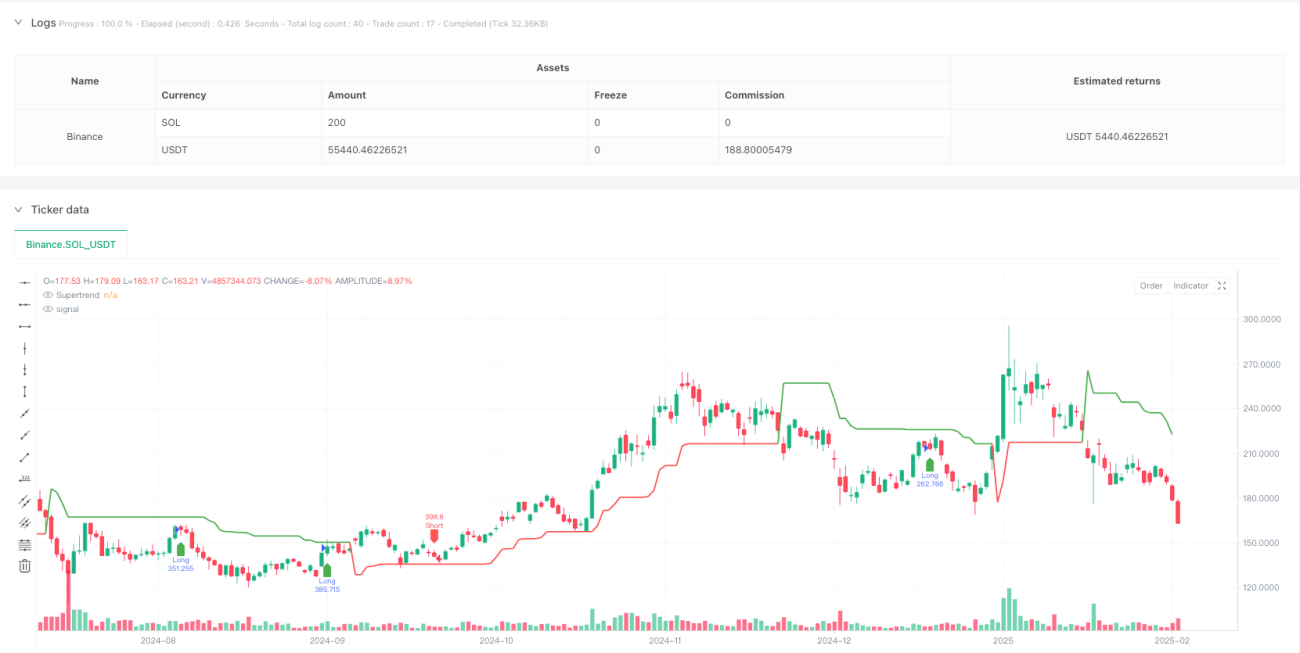
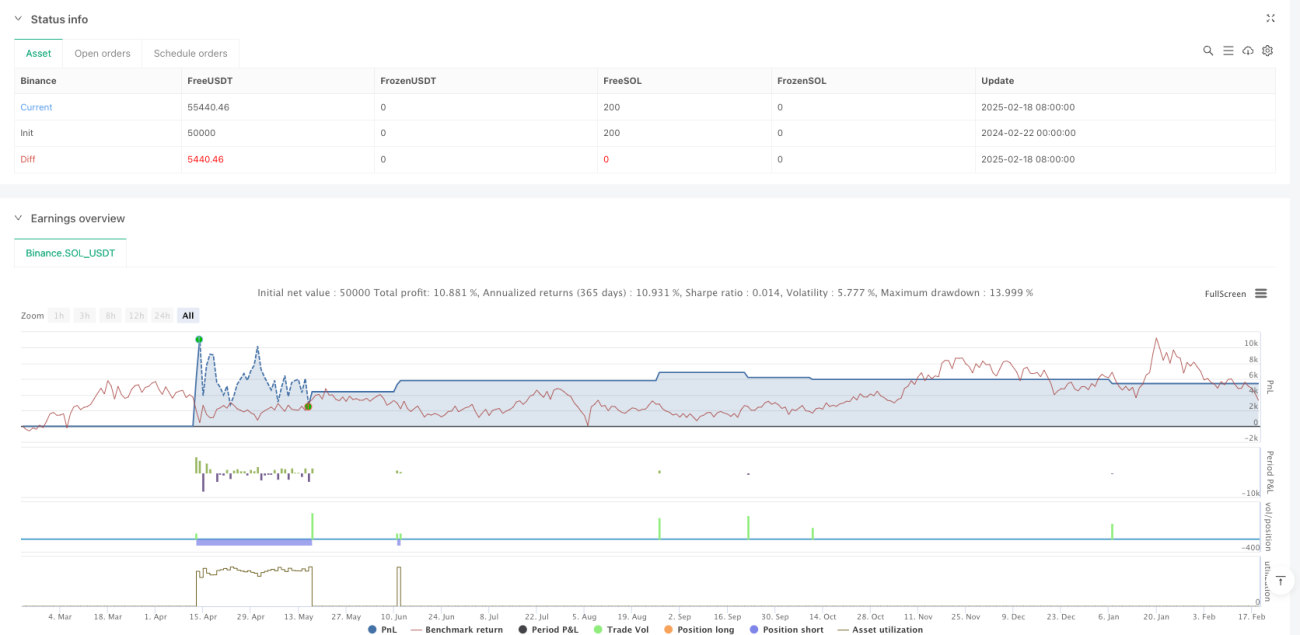
/*backtest
start: 2024-02-22 00:00:00
end: 2025-02-19 08:00:00
period: 1d
basePeriod: 1d
exchanges: [{"eid":"Binance","currency":"SOL_USDT"}]
*/

//@version=5
strategy("Optimized BTC Trading Strategy v2", overlay=true, default_qty_type=strategy.percent_of_equity, default_qty_value=100, commission_type=strategy.commission.percent, commission_value=0.1)

// Input parameters- 1