
ওভারভিউ
এই কৌশলটি একটি বুদ্ধিমান ট্রেডিং সিস্টেম যা একাধিক প্রযুক্তিগত সূচকগুলির উপর ভিত্তি করে, তিনটি প্রযুক্তিগত সূচকগুলির সাথে বোলিংগার ব্যান্ডস, স্টোক্যাস্টিক ওসিলিয়েটর এবং গড় বাস্তব তরঙ্গদৈর্ঘ্য (এটিআর) এর সমন্বিত বিশ্লেষণের মাধ্যমে সম্ভাব্য ব্যবসায়ের সুযোগগুলি সনাক্ত করতে পারে। এই কৌশলটি গতিশীল স্টপ লস এবং লাভের লক্ষ্য নির্ধারণ করে, যা বাজারের অস্থিরতার সাথে সামঞ্জস্যপূর্ণ ট্রেডিং প্যারামিটারগুলিকে স্বয়ংক্রিয়ভাবে সামঞ্জস্য করতে পারে।
কৌশল নীতি
এই কৌশলটির কেন্দ্রীয় যুক্তিটি একটি ট্রিপল ভেরিফিকেশন পদ্ধতির উপর ভিত্তি করেঃ
- বুলিন ব্যান্ড ব্যবহার করে দামের ওঠানামা করার জন্য একটি ব্যাপ্তি নির্ধারণ করা হয়, যখন দামগুলি বুলিন ব্যান্ডের নীচে চলে যায় তখন ওভারসেলের সুযোগগুলি চিহ্নিত করা হয় এবং যখন এটি উঠে যায় তখন ওভারসেলের সুযোগগুলি চিহ্নিত করা হয়
- ওভার-বই অঞ্চল ((> 80) এবং ওভার-বিক্রয় অঞ্চল ((<20) এ এলোমেলো সূচক দ্বারা গতিশীলতা নিশ্চিতকরণ,% কে লাইন এবং% ডি লাইনের ক্রস হিসাবে প্রবেশের সংকেত
- এটিআর সূচকটি একটি অস্থিরতা ফিল্টার হিসাবে প্রবর্তন করা হয়েছে যাতে পর্যাপ্ত বাজারের অস্থিরতার সমর্থনে লেনদেন নিশ্চিত করা যায়
ট্রেডিং সিগন্যালের জন্য নিম্নলিখিত শর্তগুলি পূরণ করতে হবেঃ
ক্রয়ের শর্তাবলীঃ
- বুলিনের নীচে দাম শেষ হয়েছে
- এলোমেলো সূচক %K লাইন ওভারসোল্ড অঞ্চলে%D লাইন অতিক্রম করে
- ATR মান নির্ধারিত প্রান্তিকের চেয়ে বেশি, যা যথেষ্ট বাজারের অস্থিরতা নিশ্চিত করে
বিক্রির শর্তঃ
- বুলিন বন্ডের ওপরে দাম বন্ধ
- এলোমেলো সূচক %K লাইনটি ওভারবয় অঞ্চলে%D লাইনটি অতিক্রম করে
- লেনদেনের বৈধতা নিশ্চিত করার জন্য ATR মান নিম্নমানের উপরে রয়ে গেছে
কৌশলগত সুবিধা
- একাধিক প্রযুক্তিগত সূচক ক্রস যাচাইকরণ, ট্রেডিং সিগন্যালের নির্ভরযোগ্যতা উল্লেখযোগ্যভাবে বৃদ্ধি করে
- ডায়নামিক স্টপ লস এবং রিটার্ন টার্গেট সেট করুন, বাজার অস্থিরতার উপর ভিত্তি করে ঝুঁকি ব্যবস্থাপনা প্যারামিটারগুলি স্বয়ংক্রিয়ভাবে সামঞ্জস্য করুন
- অস্থিরতা ফিল্টারিং প্রক্রিয়া কার্যকরভাবে কম ওভারল্যাপের সময় মিথ্যা সংকেত এড়াতে
- সূচক প্যারামিটারগুলি বিভিন্ন বাজারের অবস্থার সাথে নমনীয়ভাবে সামঞ্জস্যপূর্ণ এবং ভাল অভিযোজনযোগ্যতা রয়েছে
- কৌশলগত লজিক পরিষ্কার, সহজে বোঝা যায় এবং প্রয়োগ করা যায়, যা সকল স্তরের ব্যবসায়ীদের জন্য উপযুক্ত
কৌশলগত ঝুঁকি
- বাজারের তীব্র অস্থিরতার সময় স্লাইড পয়েন্টগুলি উপস্থিত হতে পারে যা প্রকৃত কার্যকর মূল্যকে প্রভাবিত করে
- একাধিক সূচক ব্যবহারের ফলে সংকেত বিলম্বিত হতে পারে এবং সেরা সময় মিস করা যায়
- অতিরিক্ত প্যারামিটার অপ্টিমাইজেশনের ফলে ওভারফিট হতে পারে, যা রিয়েল-ডিস্কে কৌশলটির কার্যকারিতা প্রভাবিত করে
- প্রবণতা পাল্টানোর সময় ভুয়া সংকেত দেখা দিতে পারে এবং অন্যান্য বিশ্লেষণ সরঞ্জামগুলির সাথে কাজ করা প্রয়োজন
- লেনদেনের খরচ এবং কমিশন কৌশলটির সামগ্রিক উপার্জন কার্যকারিতা প্রভাবিত করতে পারে
কৌশল অপ্টিমাইজেশনের দিকনির্দেশনা
- প্রবণতা সনাক্তকরণ বাড়ানোর জন্য প্রবণতা ফিল্টার যেমন একটি চলমান গড় ক্রস সিস্টেম প্রবর্তন করা
- এটিআর হ্রাসের গতিশীল সমন্বয় ব্যবস্থাকে অপ্টিমাইজ করা যাতে এটি বিভিন্ন বাজারের অবস্থার সাথে আরও ভালভাবে মানিয়ে নিতে পারে
- ট্রেডিং সিগন্যালের নির্ভরযোগ্যতা বাড়ানোর জন্য ট্রানজেকশন ইনডেক্স ভ্যালিডেশন বাড়ানো
- স্বনির্ধারিত প্যারামিটার অপ্টিমাইজেশান উপলব্ধ, বাজার অবস্থার উপর ভিত্তি করে স্বয়ংক্রিয়ভাবে সূচক প্যারামিটারগুলি সামঞ্জস্য করে
- সময় ফিল্টার যুক্ত করুন যাতে বাজারের উচ্চ অস্থিরতার সময় ট্রেডিং এড়ানো যায়
সারসংক্ষেপ
এই কৌশলটি ব্রিনব্যান্ড, এলোমেলো সূচক এবং এটিআর এর সমন্বিত প্রয়োগের মাধ্যমে একটি সম্পূর্ণ ট্রেডিং সিস্টেম তৈরি করে। কৌশলটির সুবিধা হ'ল একাধিক সূচকের ক্রস যাচাইকরণ এবং গতিশীল ঝুঁকি ব্যবস্থাপনা, তবে একই সাথে প্যারামিটার অপ্টিমাইজেশন এবং বাজার পরিবেশের অভিযোজনযোগ্যতার বিষয়েও মনোযোগ দেওয়া প্রয়োজন। ক্রমাগত অপ্টিমাইজেশন এবং পরিমার্জন দ্বারা, কৌশলটি বাস্তব ব্যবসায়ের ক্ষেত্রে স্থিতিশীল উপার্জন প্রদর্শনের সম্ভাবনা রয়েছে।
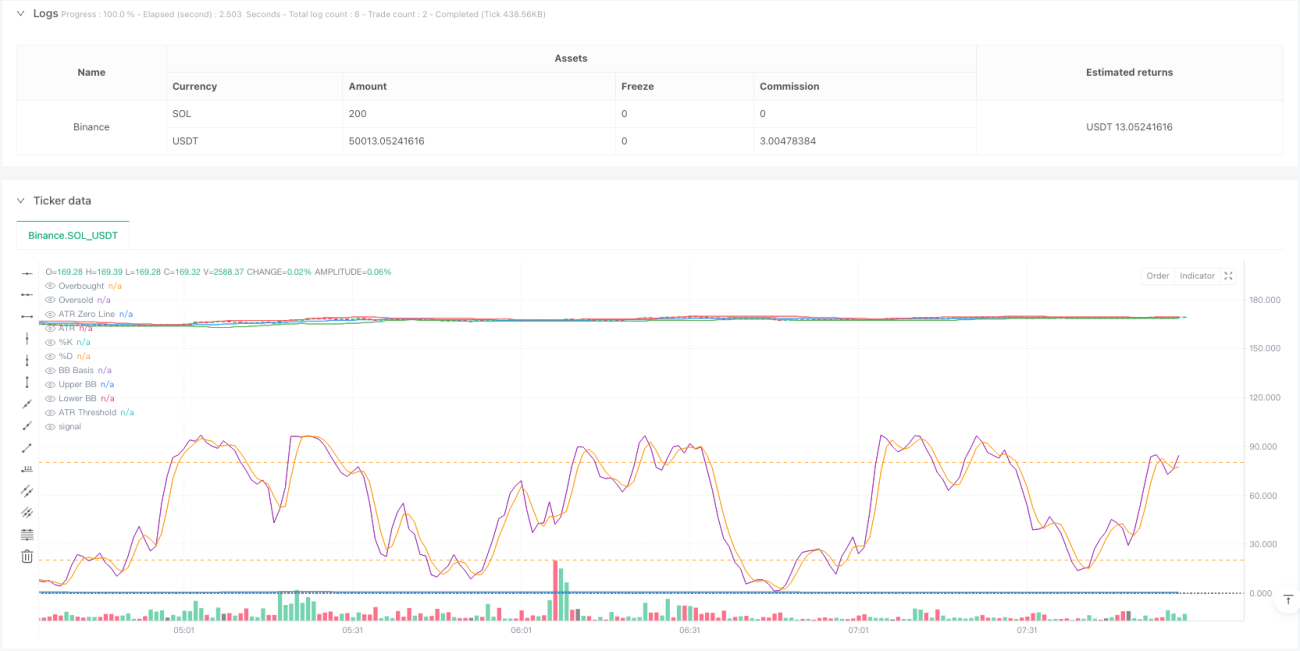
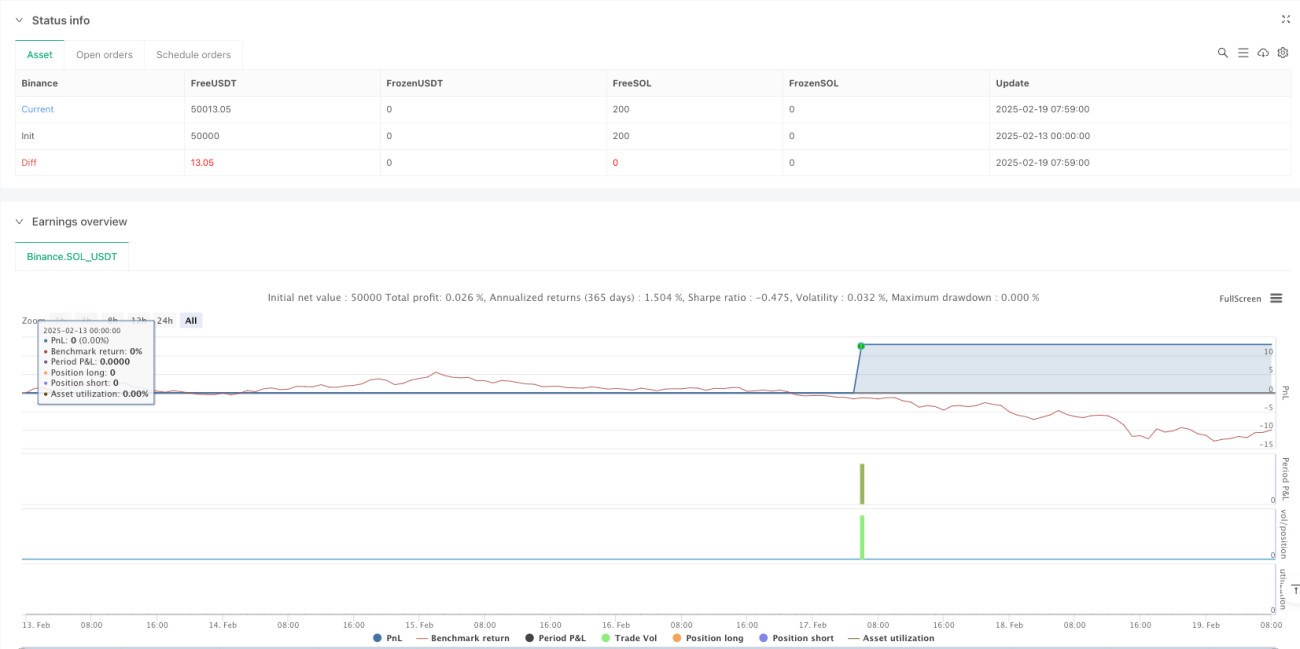
/*backtest
start: 2025-02-13 00:00:00
end: 2025-02-19 08:00:00
period: 1m
basePeriod: 1m
exchanges: [{"eid":"Binance","currency":"SOL_USDT"}]
*/

//@version=5
strategy("Bollinger Bands + Stochastic Oscillator + ATR Strategy", overlay=true, default_qty_type=strategy.percent_of_equity, default_qty_value=10)

// Bollinger Bands Parameters- 1