
ওভারভিউ
এই কৌশলটি একটি প্রবণতা ট্র্যাকিং সিস্টেম যা একাধিক চলমান গড়, গতিশীল সূচক এবং গতিশীল ঝুঁকি নিয়ন্ত্রণের সাথে মিলিত। কৌশলটি মূল্যের প্রবণতা, বাজারের গতিশীলতা এবং অস্থিরতার বিশ্লেষণের মাধ্যমে লেনদেনের সুযোগগুলি সনাক্ত করে এবং কঠোর পজিশন পরিচালনা এবং স্টপ-আউট ব্যবস্থা ব্যবহার করে ঝুঁকি নিয়ন্ত্রণ করে। দীর্ঘমেয়াদী ইন্ডেক্সের চলমান গড় ((EMA) এর ক্রস এবং অপেক্ষাকৃত শক্তিশালী দুর্বল সূচক ((RSI) এর সমন্বয় ব্যবহারের চারপাশে কেন্দ্রীয় যুক্তিটি গতিশীলভাবে স্টপ-আউট অবস্থানগুলিকে সামঞ্জস্য করে।
কৌশল নীতি
কৌশলটি ট্রেডিং সিগন্যাল নিশ্চিত করার জন্য একাধিক স্তরের যাচাইকরণ পদ্ধতি ব্যবহার করেঃ
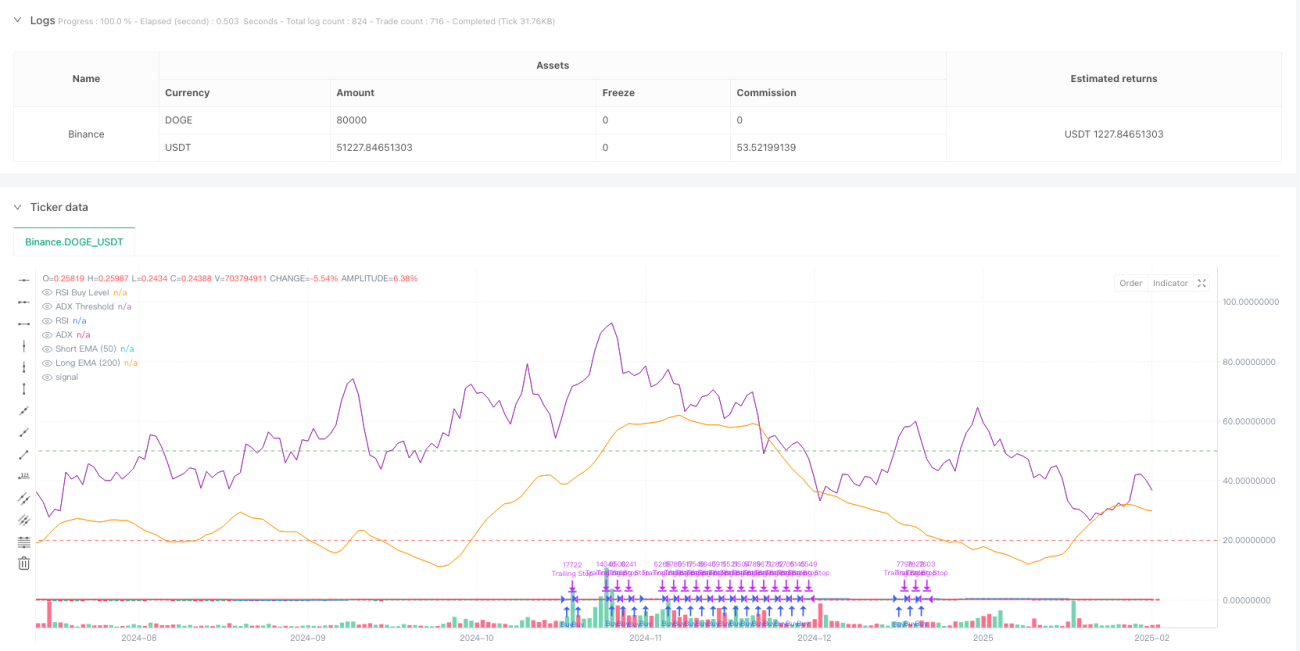
- প্রবণতা নিশ্চিতকরণঃ 50 এবং 200 দিনের দুটি সূচকীয় চলমান গড় ব্যবহার করে মাঝারি এবং দীর্ঘমেয়াদী প্রবণতা নির্ধারণ করা হয়, যার অর্থ হ'ল স্বল্পমেয়াদী গড় দীর্ঘমেয়াদী গড়ের উপরে 10 টিরও বেশি চক্র স্থায়ী হয়।
- গতিশীলতা যাচাইকরণঃ RSI সূচক ব্যবহার করে মূল্যের গতিশীলতা যাচাই করুন, যখন RSI মানটি সেট থ্রিলের চেয়ে বড় হয় (ডিফল্ট 50) তখন উত্থানের গতিশীলতা নিশ্চিত করুন।
- প্রবণতা শক্তিঃ প্রবণতা শক্তি পরিমাপ করার জন্য গড় প্রবণতা সূচক ((ADX) প্রবর্তন করা হয়, যেখানে 20 এর চেয়ে বড় ADX একটি প্রবণতা উল্লেখযোগ্য নির্দেশ করে।
- গতিশীল ঝুঁকি নিয়ন্ত্রণঃ এটিআর ডিজাইনের উপর ভিত্তি করে গতিশীল ক্ষতি, ক্ষতির দূরত্বটি এটিআর এর ২.৫ গুণ, এবং ক্ষতির ট্র্যাকিং ব্যবস্থা সেট আপ করা হয়েছে।
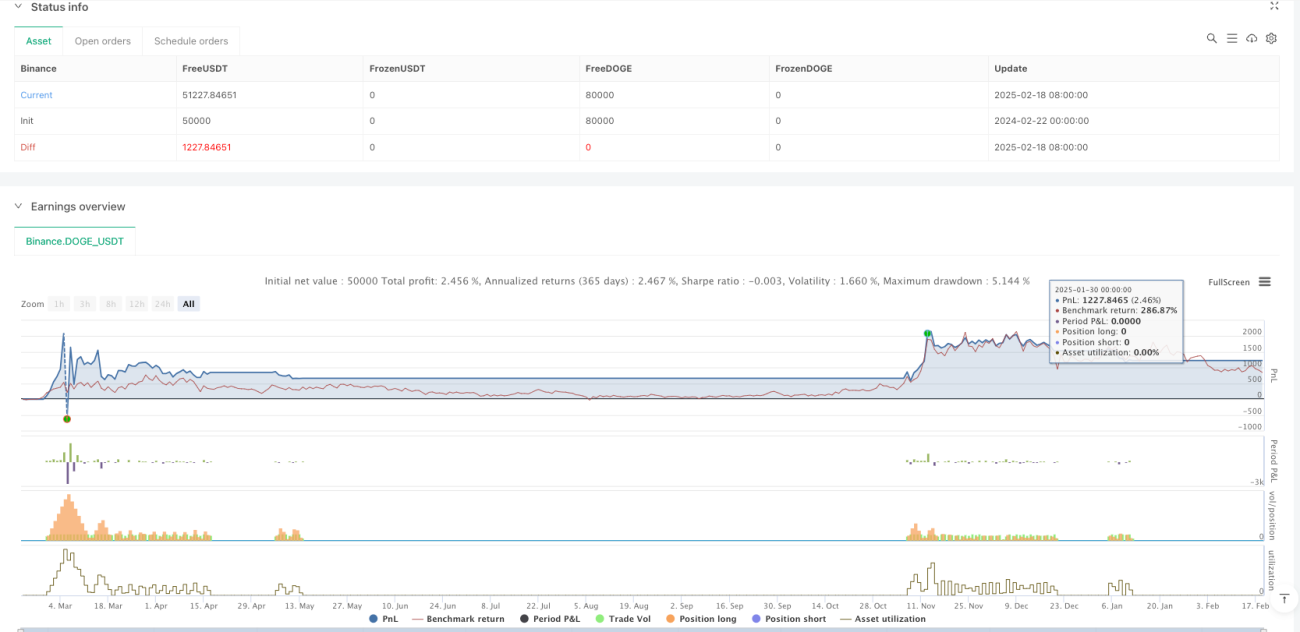
- স্মার্ট পজিশন ম্যানেজমেন্টঃ অ্যাকাউন্টের ইক্যুইটি এবং পূর্বনির্ধারিত ঝুঁকির অনুপাতের উপর ভিত্তি করে, এটিআর গতিশীলতার সাথে মিলিতভাবে খোলা পজিশনের সংখ্যা গণনা করা হয়।
কৌশলগত সুবিধা
- একাধিক সংকেত যাচাইকরণঃ গড় লাইন, গতি এবং প্রবণতা শক্তির মতো একাধিক মাত্রার সূচক যাচাইকরণের মাধ্যমে সংকেতের নির্ভরযোগ্যতা বাড়ান।
- গতিশীল ঝুঁকি ব্যবস্থাপনাঃ অস্থিরতার উপর ভিত্তি করে গতিশীল স্টপ এবং ট্র্যাকিং স্টপ ব্যবহার করে, যা বাজারের অবস্থার সাথে খাপ খাইয়ে নিতে সক্ষম।
- স্মার্ট পজিশন কন্ট্রোলঃ অ্যাকাউন্টের আকার এবং বাজারের অস্থিরতার উপর ভিত্তি করে পজিশনগুলিকে গতিশীলভাবে সামঞ্জস্য করে, একক লেনদেনের ঝুঁকি কার্যকরভাবে নিয়ন্ত্রণ করে।
- প্রবণতা ধারাবাহিকতার প্রয়োজনীয়তাঃ প্রবণতা ধারাবাহিকতার প্রয়োজনীয়তা সেট করে মিথ্যা ব্রেকআউট এড়ানো যায়।
- সিস্টেমাইজড ট্রেডিং টিপসঃ ইন্টিগ্রেটেড ট্রেডিং সিগন্যাল রিমাইন্ডার ফাংশন, রিয়েল-টাইম অপারেশন সহজতর।
কৌশলগত ঝুঁকি
- প্রবণতা বিপরীত ঝুঁকিঃ একটি শক্তিশালী প্রবণতা শেষ হওয়ার পরে একটি বড় প্রত্যাহার দেখা দিতে পারে, বাজার ম্যাক্রো দিকের সাথে সামঞ্জস্য করার পরামর্শ দেওয়া হয়।
- ঝড়ের বাজারঃ ঘন ঘন লেনদেনের ফলে লেনদেনের খরচ বাড়তে পারে।
- প্যারামিটার সংবেদনশীলতাঃ একাধিক সূচক প্যারামিটার সেটিং কৌশল কর্মক্ষমতা প্রভাবিত করতে পারে, এবং ফিডব্যাক দ্বারা অপ্টিমাইজ করা প্রয়োজন।
- স্লাইড পয়েন্ট প্রভাবঃ বাজারে তরলতা কম থাকলে বড় স্লাইড পয়েন্টের সম্মুখীন হতে পারে, যা কৌশলগত উপার্জনকে প্রভাবিত করে।
কৌশল অপ্টিমাইজেশনের দিকনির্দেশনা
- বাজারের পরিবেশের সাথে খাপ খাইয়ে নেওয়াঃ বিভিন্ন বাজারের পরিবেশের সাথে খাপ খাইয়ে নেওয়ার জন্য কৌশলগত প্যারামিটারগুলিকে গতিশীলভাবে সামঞ্জস্য করার জন্য ওঠানামা সূচক (যেমন ভিআইএক্স) প্রবর্তন করা যেতে পারে।
- সিগন্যাল ফিল্টারিংঃ ট্রানজাকশন ইন্ডিকেটর যাচাইকরণ যোগ করার কথা ভাবুন, সিগন্যালের গুণমান উন্নত করুন।
- স্টপ মেশিনঃ মুনাফা প্রত্যাহারের অনুপাত অনুকূলিতকরণের জন্য বাজারের অস্থিরতার উপর ভিত্তি করে একটি গতিশীল স্টপ মেশিন ডিজাইন করা যেতে পারে।
- টাইমসাইকেল অপ্টিমাইজেশনঃ বিভিন্ন টাইমসাইকেলে সিগন্যালের সামঞ্জস্যতা যাচাই করার কথা বিবেচনা করুন, যাতে লেনদেনের স্থিতিশীলতা বৃদ্ধি পায়।
- মেশিন লার্নিং অপ্টিমাইজেশানঃ মেশিন লার্নিং অ্যালগরিদমের গতিশীল অপ্টিমাইজেশান প্যারামিটারগুলি প্রবর্তন করা যেতে পারে, যা কৌশলগত অভিযোজনযোগ্যতা বাড়ায়।
সারসংক্ষেপ
এই কৌশলটি একাধিক প্রযুক্তিগত সূচকগুলির সমন্বিত ব্যবহারের মাধ্যমে একটি সম্পূর্ণ প্রবণতা ট্র্যাকিং ট্রেডিং সিস্টেম তৈরি করে। কৌশলটি ঝুঁকি নিয়ন্ত্রণের ক্ষেত্রে দুর্দান্ত কাজ করে, গতিশীল স্টপ লস এবং পজিশন ম্যানেজমেন্টের মাধ্যমে কার্যকরভাবে প্রত্যাহার নিয়ন্ত্রণ করে। কৌশলটি শক্তিশালী এবং একাধিক অপ্টিমাইজেশনের দিকগুলি সংরক্ষণ করে। ব্যবসায়ীরা নির্দিষ্ট বাজারের বৈশিষ্ট্য এবং তাদের নিজস্ব ঝুঁকি পছন্দ অনুসারে প্যারামিটারগুলি সামঞ্জস্য করার পরামর্শ দেয়।
Overview
This strategy is a trend following system that combines multiple moving averages, momentum indicators, and dynamic risk control. It identifies trading opportunities by analyzing price trends, market momentum, and volatility while implementing strict position management and stop-loss mechanisms. The core logic revolves around the crossover of long and short-term exponential moving averages (EMA) combined with the Relative Strength Index (RSI), using Average True Range (ATR) for dynamic stop-loss positioning.
Strategy Principles
The strategy employs a multi-layer verification mechanism to confirm trading signals:
- Trend Confirmation: Uses 50-day and 200-day EMAs to judge medium and long-term trends, requiring the short-term average to remain above the long-term average for more than 10 periods.
- Momentum Verification: Uses RSI to verify price momentum, confirming upward momentum when RSI exceeds the set threshold (default 50).
- Trend Strength: Incorporates Average Directional Index (ADX) to measure trend strength, with ADX above 20 indicating significant trend.
- Dynamic Risk Control: Designs dynamic stop-loss based on ATR, with stop-loss distance set at 2.5 times ATR, including trailing stop mechanism.
- Intelligent Position Management: Dynamically calculates position size based on account equity and preset risk ratio in combination with ATR.
Strategy Advantages
- Multiple Signal Verification: Improves signal reliability through validation across multiple dimensions including moving averages, momentum, and trend strength.
- Dynamic Risk Management: Employs volatility-based dynamic and trailing stops that adapt to market conditions.
- Intelligent Position Control: Dynamically adjusts positions based on account size and market volatility, effectively controlling single trade risk.
- Trend Persistence Requirement: Avoids false breakouts by setting trend duration requirements.
- Systematic Trading Alerts: Integrates trading signal notifications for real-time operation.
Strategy Risks
- Trend Reversal Risk: May experience significant drawdowns at trend endings, suggesting adjustment based on macro market conditions.
- Sideways Market Performance: May generate frequent trades in range-bound markets, increasing transaction costs.
- Parameter Sensitivity: Strategy performance affected by multiple indicator parameters, requiring backtest optimization.
- Slippage Impact: May face significant slippage in low liquidity conditions, affecting strategy returns.
Optimization Directions
- Market Environment Adaptation: Consider introducing volatility indicators (like VIX) for dynamic parameter adjustment to improve adaptability across different market conditions.
- Signal Filtering: Consider adding volume indicator verification to improve signal quality.
- Profit-Taking Mechanism: Design dynamic profit-taking mechanisms based on market volatility to optimize return-to-drawdown ratio.
- Timeframe Optimization: Consider validating signal consistency across different timeframes to improve trading stability.
- Machine Learning Optimization: Consider introducing machine learning algorithms for dynamic parameter optimization to enhance strategy adaptability.
Summary
This strategy constructs a complete trend following trading system through the comprehensive use of multiple technical indicators. It shows excellent performance in risk control through dynamic stop-loss and position management. The strategy demonstrates strong extensibility with multiple optimization directions reserved. Traders are advised to adjust parameters according to specific market characteristics and their own risk preferences when implementing in live trading.
- 1