RSI এবং Stochastic RSI এর উপর ভিত্তি করে ডুয়াল মোমেন্টাম ট্রেন্ড রিভার্সাল কৌশল

ওভারভিউ
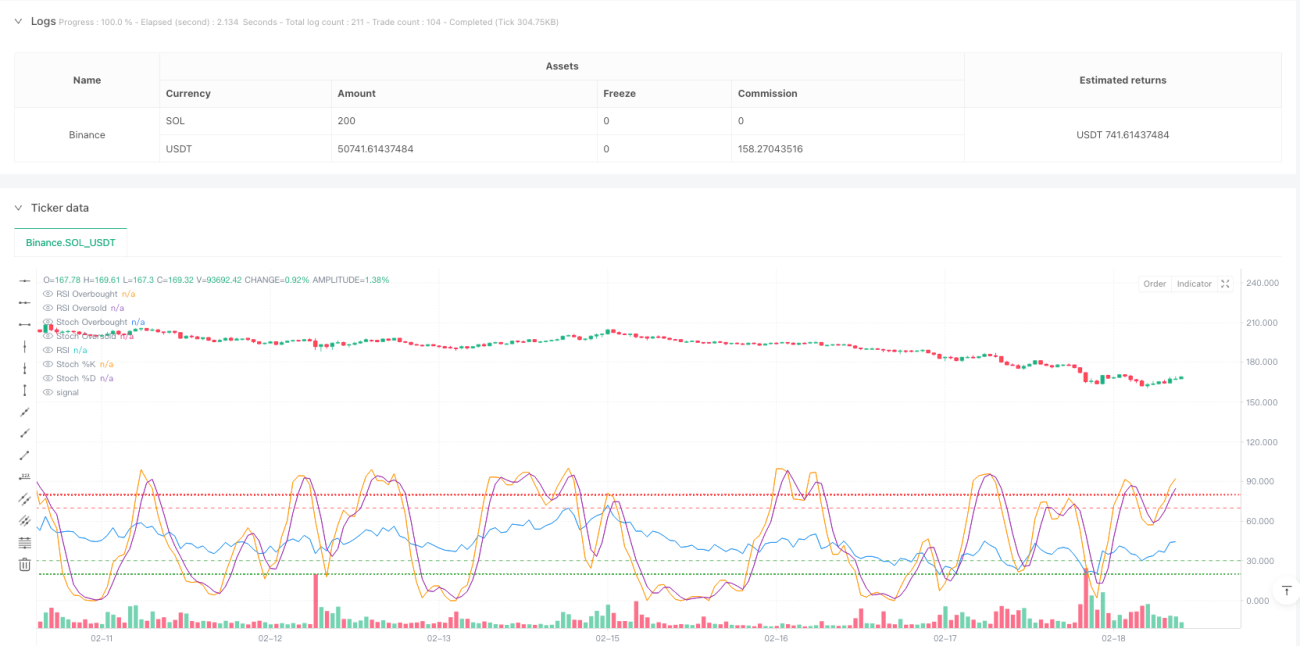
এটি একটি প্রবণতা বিপরীত ট্রেডিং কৌশল যা তুলনামূলকভাবে দুর্বল সূচক ((আরএসআই) এবং এলোমেলো তুলনামূলকভাবে দুর্বল সূচক ((স্টোক্যাস্টিক আরএসআই) এর সাথে মিলিত হয়। এই কৌশলটি বাজারের ওভারব্রেড ওভারসোলের অবস্থা এবং গতিশীলতার পরিবর্তনগুলি সনাক্ত করে সম্ভাব্য বিপরীত পয়েন্টগুলিকে ক্যাপচার করে, যার ফলে ট্রেডিং করা যায়। কৌশলটির মূলটি হল আরএসআইকে একটি মৌলিক গতিশীলতার সূচক হিসাবে ব্যবহার করা এবং তার ভিত্তিতে স্টোক্যাস্টিক আরএসআই গণনা করা যাতে দামের গতিশীলতার পরিবর্তনের দিকটি আরও নিশ্চিত করা যায়।
কৌশল নীতি
কৌশলটির মূল যুক্তি নিম্নলিখিত মূল পদক্ষেপগুলি নিয়ে গঠিতঃ
- প্রথমত, সমাপ্তির মূল্যের RSI গণনা করা হয়, যা সামগ্রিক ওভারব্রেড ওভারসোল্ডের মূল্যায়ন করে
- স্টোক্যাস্টিক RSI এর %K লাইন এবং %D লাইন RSI মানের উপর ভিত্তি করে গণনা করা হয়
- যখন RSI oversold অঞ্চলে থাকে (ডিফল্ট 30 এর নিচে) এবং স্টোক্যাস্টিক RSI এর %K লাইনটি%D লাইনটি অতিক্রম করে, তখন একটি মাল্টি-সিগন্যাল ট্রিগার হয়
- RSI যখন ওভারবোর অঞ্চলে থাকে (ডিফল্ট 70 এর উপরে) এবং স্টোক্যাস্টিক RSI এর %K লাইনটি%D লাইনটি উপরে থেকে নীচে অতিক্রম করে, তখন একটি ফাঁকা সংকেত ট্রিগার করে
- যখন বিপরীত RSI শর্ত বা Stochastic RSI বিপরীত ক্রস হয়, তখন প্লেইন পজিশন থেকে বেরিয়ে আসে
কৌশলগত সুবিধা
- ডাবল কনফার্মেশন মেকানিজম - RSI এবং Stochastic RSI এর সমন্বয় ব্যবহার করে, মিথ্যা ব্রেকআউটের ঝুঁকি কার্যকরভাবে হ্রাস করতে পারে
- কাস্টমাইজযোগ্য প্যারামিটার - কৌশলটির মূল প্যারামিটারগুলি যেমন আরএসআই চক্র, ওভারবয় ওভারসোল থ্রেশহোল্ড ইত্যাদি বিভিন্ন বাজারের অবস্থার সাথে সামঞ্জস্য করতে পারে
- ডায়নামিক ভিজ্যুয়ালাইজেশন - কৌশলটি আরএসআই এবং স্টোক্যাস্টিক আরএসআইয়ের রিয়েল-টাইম চার্ট প্রদর্শন করে যা ট্রেডারদের পর্যবেক্ষণের জন্য সহজ করে তোলে
- ঝুঁকি ব্যবস্থাপনার সমন্বয় - সম্পূর্ণ স্টপ লস এবং রিটার্ন বন্ধের ব্যবস্থা রয়েছে
- দৃঢ় অভিযোজনযোগ্যতা - বিভিন্ন সময়কাল এবং বাজার পরিবেশে প্রয়োগ করা যেতে পারে
কৌশলগত ঝুঁকি
- অস্থির বাজার ঝুঁকি - প্রায়শই মিথ্যা সংকেত তৈরি হতে পারে যখন বাজারটি তির্যকভাবে অস্থির হয়
- বিলম্বের ঝুঁকি - একাধিক গড় সমতল ব্যবহারের কারণে সংকেতটি কিছুটা বিলম্বিত হতে পারে
- প্যারামিটার সংবেদনশীলতা - বিভিন্ন প্যারামিটার সেটিং উল্লেখযোগ্যভাবে ভিন্ন লেনদেনের ফলাফল হতে পারে
- বাজার পরিবেশের উপর নির্ভরশীলতা - একটি শক্তিশালী প্রবণতা বাজারে কিছু অংশ মিস করতে পারে
- তহবিল পরিচালনার ঝুঁকি - ঝুঁকি নিয়ন্ত্রণের জন্য যুক্তিসঙ্গতভাবে হোল্ডিং অনুপাত সেট করা প্রয়োজন
কৌশল অপ্টিমাইজেশনের দিকনির্দেশনা
- ট্রেন্ডিং ফিল্টার যোগ করুন - ট্রেন্ডিং ফিল্টার হিসাবে দীর্ঘমেয়াদী চলমান গড় যোগ করতে পারেন, শুধুমাত্র ট্রেন্ডিং দিকের উপর অবস্থান খুলুন
- অপ্টিমাইজড স্টপ মেকানিজম - ডায়নামিক স্টপ যেমন ট্র্যাকিং স্টপ বা এটিআর স্টপ চালু করা যেতে পারে
- ট্র্যাফিক পরিমাপক প্রবর্তন - সংমিশ্রিত ট্র্যাফিক বিশ্লেষণ সংকেতের নির্ভরযোগ্যতা উন্নত করতে পারে
- টাইম ফিল্টার যুক্ত করুন - গুরুত্বপূর্ণ সংবাদ প্রকাশনা বা কম সচলতার সময় এড়াতে
- স্বনির্ধারিত প্যারামিটার তৈরি করুন - বাজার ওঠানামা অনুযায়ী কৌশলগত প্যারামিটারগুলি স্বয়ংক্রিয়ভাবে সামঞ্জস্য করুন
সারসংক্ষেপ
এটি একটি সমন্বিত কৌশল যা গতিশীলতা এবং প্রবণতা বিপরীতকরণের সমন্বয় করে, আরএসআই এবং স্টোক্যাস্টিক আরএসআইয়ের সমন্বয়মূলক কার্যকারিতার মাধ্যমে সম্ভাব্য ব্যবসায়ের সুযোগগুলি সনাক্ত করে। কৌশলটি যুক্তিসঙ্গতভাবে ডিজাইন করা হয়েছে, ভাল সামঞ্জস্যযোগ্যতা এবং অভিযোজনযোগ্যতা রয়েছে। তবে বাস্তব প্রয়োগে বাজারের পরিবেশের পছন্দ এবং ঝুঁকি নিয়ন্ত্রণের দিকে মনোযোগ দেওয়া দরকার, রিয়েল-টাইম ট্রেডিংয়ের আগে পর্যাপ্ত ফিডব্যাক এবং প্যারামিটার অপ্টিমাইজেশন করার পরামর্শ দেওয়া হয়।
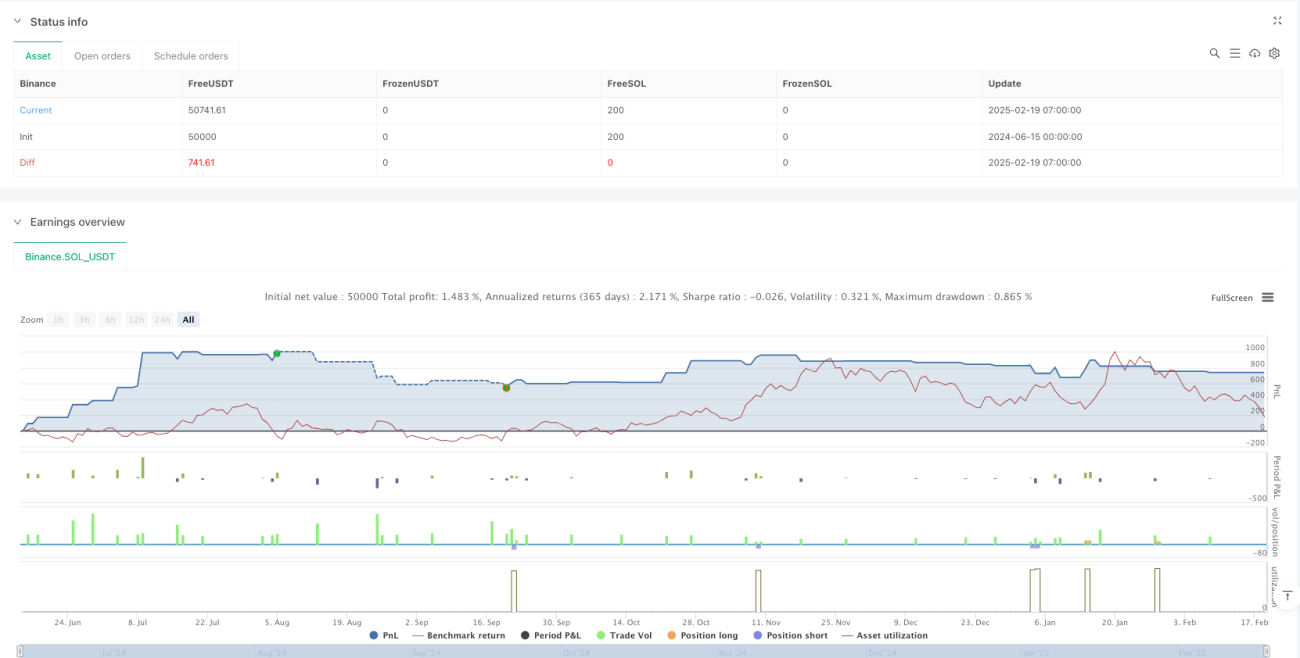
/*backtest
start: 2024-06-15 00:00:00
end: 2025-02-19 08:00:00
period: 1h
basePeriod: 1h
exchanges: [{"eid":"Binance","currency":"SOL_USDT"}]
*/

//@version=5
strategy("RSI + Stochastic RSI Strategy", overlay=true, initial_capital=100000, default_qty_type=strategy.percent_of_equity, default_qty_value=10)

// INPUTS- 1