
ওভারভিউ
এই কৌশলটি একটি সমন্বিত পরিমাণগত ট্রেডিং পদ্ধতি যা একাধিক প্রযুক্তিগত সূচক (ম্যাকড, সুপারট্রেন্ড এবং প্যারাবলিক এসএআর) এর সমন্বয় দ্বারা বাজার প্রবণতা এবং ট্রেডিং সংকেত সনাক্ত করে। এই কৌশলটি একটি নমনীয় এবং কঠোর ট্রেডিং সিদ্ধান্তের কাঠামো সরবরাহ করার উদ্দেশ্যে তৈরি করা হয়েছে যা বিভিন্ন বাজার পরিবেশের সাথে খাপ খায়।
কৌশল নীতি
এই কৌশলটি তিনটি গুরুত্বপূর্ণ প্রযুক্তিগত সূচকের একটি গতিশীল সমন্বয় ভিত্তিকঃ
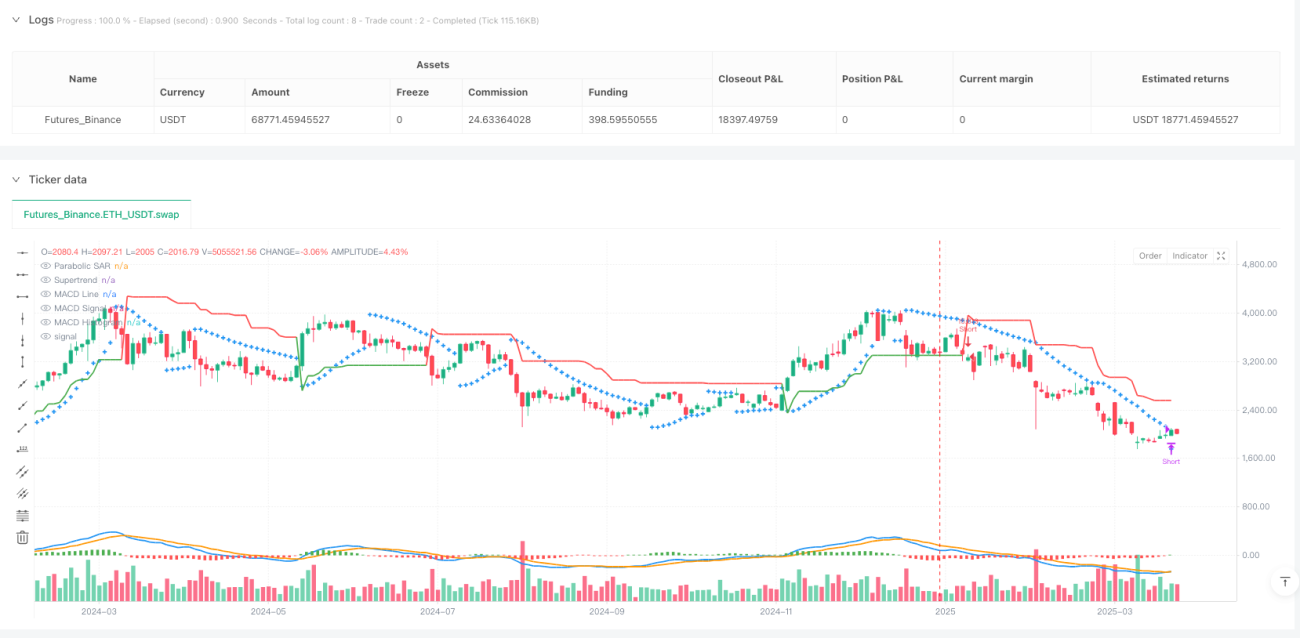
- MACD সূচকঃ মূল্যের গতিশীলতা এবং প্রবণতার দিকনির্দেশের মূল্যায়ন
- সুপারট্রেন্ড সূচকঃ বাজারের প্রভাবশালী প্রবণতা নির্ধারণ করুন (মাল্টি হেড বা ফাঁকা হেড)
- প্যারাবোলিক এসএআরঃ সঠিক প্রবেশ ও প্রস্থান সংকেত প্রদান করে
কৌশলটি নিম্নলিখিত লজিকের মাধ্যমে লেনদেনের সিদ্ধান্ত নেয়ঃ
- লং পজিশনে প্রবেশের শর্তঃ
- MACD লাইনটি সিগন্যাল লাইনের চেয়ে উচ্চতর
- সুপারট্রেন্ড সবুজ (মাল্টি-ট্রেন্ড)
- প্যারাবলিক এসএআর-এর চেয়ে বেশি দামে বন্ধ
- খালি গুদামে প্রবেশের শর্তঃ
- MACD লাইন সিগন্যাল লাইনের নিচে
- সুপারট্রেন্ড লাল (খালি)
- প্যারাবলিক এসএআর-এর নিচে দর
কৌশলগত সুবিধা
- মাল্টি-ইনডিকেটর ইন্টিগ্রেটেড ভেরিফিকেশনঃ ভুয়া সংকেতের ঝুঁকি কমানো
- নমনীয় সিগন্যাল ট্রিগারঃ সূচকগুলিকে ক্রম অনুসারে ট্রিগার করার কঠোর প্রয়োজন নেই
- পূর্ণ-হোল্ড ট্রেডিং কৌশলঃ প্রতিটি লেনদেনের সম্ভাব্য আয় সর্বাধিক করুন
- সমান্তরাল ট্রেডিং লজিকঃ মাল্টিহেড এবং ব্রেকহেড মার্কেটে একত্রীকরণ
- গতিশীল আউট প্রক্রিয়াঃ দুইটি পরপর K-লাইন দিয়ে নিশ্চিতকরণ, অকালে আউট হওয়া এড়ানো
কৌশলগত ঝুঁকি
- সূচক পিছিয়ে যাওয়ার ঝুঁকিঃ প্রযুক্তিগত সূচকগুলি ঐতিহাসিক তথ্যের উপর ভিত্তি করে এবং বিলম্ব হতে পারে
- সম্পূর্ণ পজিশনের ট্রেডিংয়ের ঝুঁকিঃ অপ্রচলিত স্টপ লস বৃহত্তর তহবিলের অস্থিরতা সৃষ্টি করতে পারে
- বাজারের তীব্র অস্থিরতার ঝুঁকিঃ জটিল বাজার পরিবেশ কৌশলগত কর্মক্ষমতা প্রভাবিত করতে পারে
- প্যারামিটার সংবেদনশীলতাঃ নির্দেশক প্যারামিটার নির্বাচন সরাসরি কৌশল প্রভাব প্রভাবিত করে
কৌশল অপ্টিমাইজেশনের দিকনির্দেশনা
- ডায়নামিক পজিশন ম্যানেজমেন্ট চালু করুনঃ বাজারের অস্থিরতার উপর ভিত্তি করে পজিশনের আকার পরিবর্তন করুন
- ক্যাপ হ্রাসঃ একক লেনদেনের সর্বোচ্চ ক্ষতি হ্রাস করুন
- সূচক প্যারামিটারগুলি অপ্টিমাইজ করুনঃ সর্বোত্তম প্যারামিটার সমন্বয় খুঁজে বের করুন
- অতিরিক্ত ফিল্টারিং শর্তাবলী প্রবর্তন করাঃ যেমন লেনদেনের পরিমাণ, ওঠানামা পরিমাপক
- মাল্টি টাইম ফ্রেম ভ্যালিডেশনঃ সিগন্যালের নির্ভরযোগ্যতা বৃদ্ধি
সারসংক্ষেপ
Vishal's Adaptive Multi Indicator Trading Strategy হল একটি উদ্ভাবনী পরিমাণগত ট্রেডিং পদ্ধতি যা MACD, Supertrend এবং Parabolic SAR এর সমন্বয়মূলক কার্যকারিতার মাধ্যমে একটি বিস্তৃত এবং নমনীয় ট্রেডিং সিদ্ধান্ত গ্রহণের কাঠামো সরবরাহ করে। যদিও কিছু ঝুঁকি রয়েছে, তবে এর বহু-ইনডিকেটর যাচাইকরণ এবং সিম্যাট্রিক ট্রেডিং লজিক বিনিয়োগকারীদের জন্য একটি গভীরভাবে অধ্যয়নরত ট্রেডিং মডেল সরবরাহ করে।
/*backtest
start: 2025-01-01 00:00:00
end: 2025-03-27 00:00:00
period: 2d
basePeriod: 2d
exchanges: [{"eid":"Futures_Binance","currency":"ETH_USDT"}]
*/

//@version=6
strategy("Vishal Strategy", overlay=true, margin_long=100, margin_short=100, initial_capital=100000, default_qty_type=strategy.percent_of_equity, default_qty_value=100)

// **MACD Inputs & Calculation**- 1