ওভারভিউ
এটি একটি উদ্ভাবনী কোয়ান্টাম ট্রেডিং কৌশল যা ব্যবসায়ীদের জন্য একটি কাঠামোগত ট্রেডিং পদ্ধতি প্রদান করে যা তরল অঞ্চল প্রবেশ, এটিআর ওঠানামা এবং গতিশীল ঝুঁকি ব্যবস্থাপনার সমন্বয় করে। এই কৌশলটি একাধিক প্রযুক্তিগত বিশ্লেষণের সূচকগুলিকে সংযুক্ত করে যা উচ্চ সম্ভাব্যতার ব্যবসায়ের সুযোগগুলি সনাক্ত করতে এবং স্বয়ংক্রিয়ভাবে স্টপ এবং স্টপ লস স্তরগুলি গণনা করার জন্য ডিজাইন করা হয়েছে।
কৌশল নীতি
এই কৌশলটি নিম্নলিখিত মূল উপাদানগুলির উপর ভিত্তি করে তৈরি করা হয়েছেঃ
- তরল অঞ্চল বিশ্লেষণঃ একটি নির্দিষ্ট সময়ের মধ্যে সর্বনিম্ন এবং সর্বোচ্চ পয়েন্ট গণনা করে সম্ভাব্য সমর্থন এবং প্রতিরোধের অঞ্চলগুলি চিহ্নিত করুন।
- ATR ওঠানামার হার ফিল্টার করুনঃ প্রবেশ এবং ঝুঁকি ব্যবস্থাপনার জন্য গতিশীল থ্রেশহোল্ড হিসাবে গড় বাস্তব ওঠানামার পরিসীমা ((ATR) ব্যবহার করুন।
- প্রবণতা ফিল্টারঃ 50 পিরিয়ডের ইন্ডেক্স মুভিং এভারেজ (ইএমএ) এবং আপেক্ষিকভাবে শক্তিশালী সূচক (আরএসআই) এর সাথে মিলিত হয়ে বাজারের প্রবণতা এবং গতিশীলতা নিশ্চিত করে।
- ডায়নামিক রিস্ক ম্যানেজমেন্টঃ এটিআর-এর উপর ভিত্তি করে স্বয়ংক্রিয়ভাবে স্টপ এবং স্টপ লস লেভেল গণনা করা হয় এবং ঝুঁকি / রিটার্ন অনুপাতের নমনীয়তা নির্ধারণের অনুমতি দেওয়া হয়।
কৌশলগত সুবিধা
- মাল্টি-ডাইমেনশনাল সিগন্যাল জেনারেশনঃ তরলতা, ওঠানামা এবং প্রবণতা ফিল্টারিংয়ের সাথে সংযুক্ত, সংকেতের গুণমান উন্নত করে।
- স্বনির্ধারিত ঝুঁকি ব্যবস্থাপনাঃ গতিশীলভাবে স্টপ লস এবং স্টপ লস সামঞ্জস্য করা, কার্যকরভাবে ট্রেডিং ঝুঁকি নিয়ন্ত্রণ করা।
- নমনীয় প্যারামিটার কনফিগারেশনঃ এটিআর দৈর্ঘ্য, তরলতা চক্র এবং লেনদেনের সময় কাস্টমাইজ করা যায়।
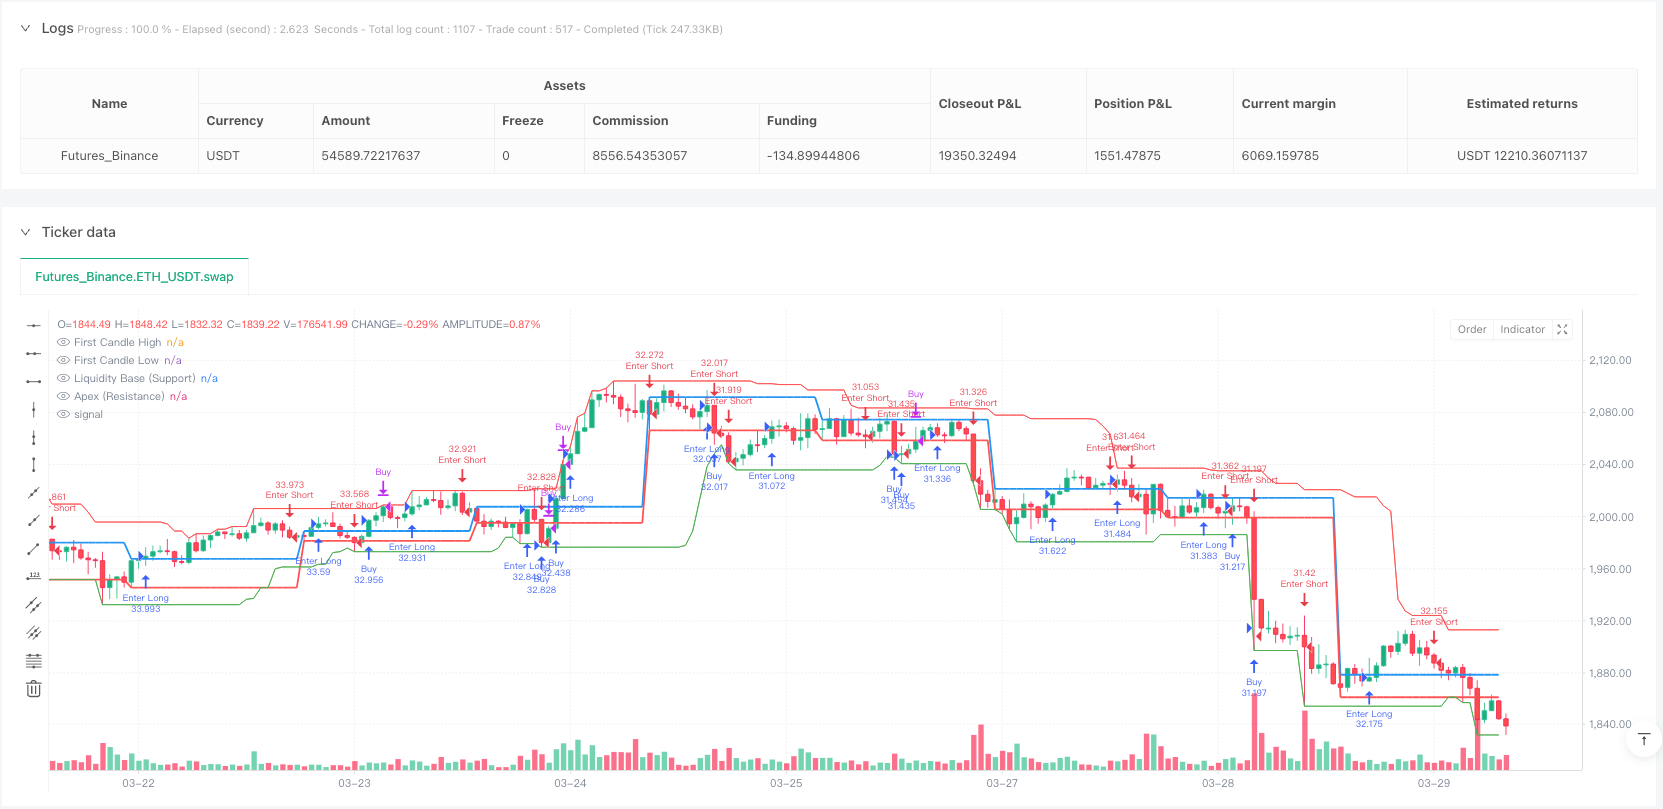
- ভিজ্যুয়ালাইজেশন সমর্থনঃ তরলতা লাইন এবং প্রথম K লাইন স্তরের ভিজ্যুয়ালাইজেশন প্রদর্শন।
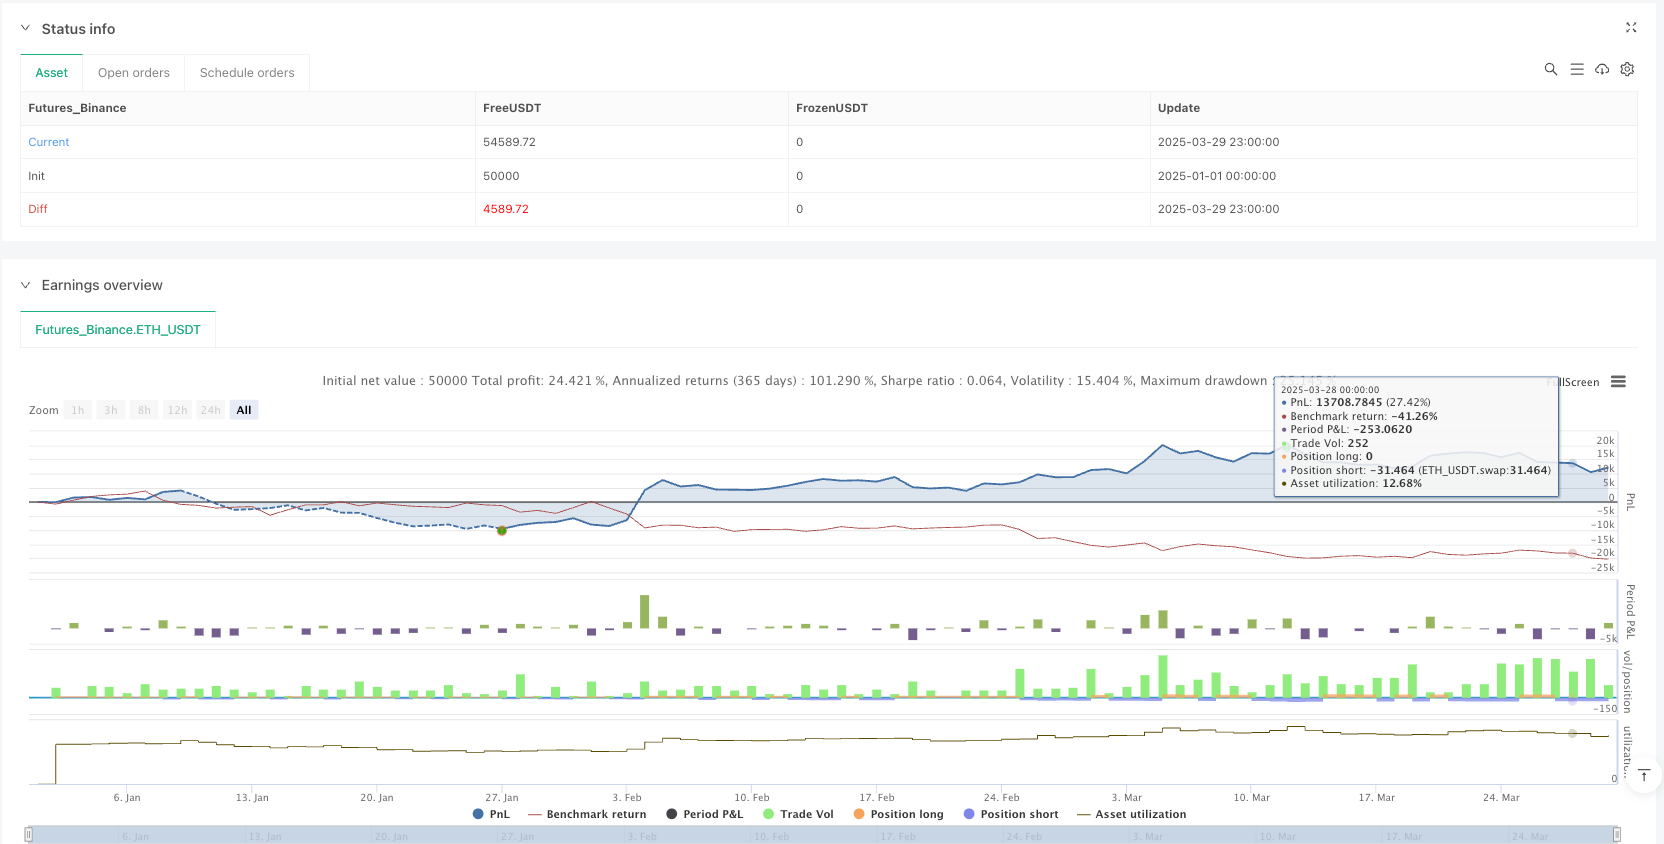
- পারফরম্যান্স ট্র্যাকিংঃ বিল্ট-ইন ট্রেডিং স্ট্যাটাস টেবিল, যা সরাসরি চার্টে বিজয়ী হার এবং হারানো হার দেখায়।
কৌশলগত ঝুঁকি
- প্যারামিটার সংবেদনশীলতা: কৌশলগত কর্মক্ষমতা অত্যন্ত প্যারামিটার নির্বাচনের উপর নির্ভরশীল, যার জন্য ক্রমাগত পুনরায় পরীক্ষা এবং অপ্টিমাইজেশন প্রয়োজন।
- বাজার অভিযোজনযোগ্যতাঃ প্রবণতা অস্পষ্ট বা উচ্চতর অস্থিরতা বাজার মধ্যে অস্থির হতে পারে।
- ভুয়া ব্রেকিংয়ের ঝুঁকিঃ লিকুইডিটি জোনের ব্রেকিংয়ের ক্ষেত্রে ভুল রিপোর্ট হওয়ার সম্ভাবনা রয়েছে।
- ট্রেডিং ফ্রিকোয়েন্সিঃ সেশন ফিল্টারিং এবং একাধিক শর্তাবলী ট্রেডিংয়ের সুযোগ হ্রাস করতে পারে।
- পুনরুদ্ধারঃ ইতিহাসের ৬৪% সাফল্য ভবিষ্যতের সম্ভাব্য ফলাফলের প্রতিনিধিত্ব করতে পারে না।
কৌশল অপ্টিমাইজেশনের দিকনির্দেশনা
- মেশিন লার্নিং ইন্টিগ্রেশনঃ মেশিন লার্নিং অ্যালগরিদমের প্রবর্তন যা গতিশীলভাবে প্যারামিটার এবং সংকেত উত্পাদন করে।
- মাল্টি মার্কেট অভিযোজনযোগ্যতা: বিভিন্ন বাজার এবং জাতের জন্য আরও সাধারণ প্যারামিটার সেটিং তৈরি করা।
- গভীরতা ঝুঁকি ব্যবস্থাপনাঃ আরো জটিল পজিশনের আকার এবং ঝুঁকি বন্টন অ্যালগরিদম প্রবর্তন।
- সিগন্যাল নিশ্চিতকরণ ব্যবস্থাঃ অতিরিক্ত নিশ্চিতকরণ সূচক যেমন লেনদেনের পরিমাণ বা অন্যান্য প্রযুক্তিগত সূচক যুক্ত করুন।
- রিয়েল-টাইম পারফরম্যান্স মনিটরিংঃ রিয়েল-টাইম পারফরম্যান্স মূল্যায়ন এবং স্বনির্ধারণযোগ্যতা মডিউল বিকাশ।
সারসংক্ষেপ
ThinkTech AI ট্রেডিং কৌশলটি ট্রেডারদের জন্য একটি শক্তিশালী পরিমাণগত ট্রেডিং সরঞ্জাম সরবরাহ করে। এটি তরলতা বিশ্লেষণ, অস্থিরতা ফিল্টারিং এবং গতিশীল ঝুঁকি ব্যবস্থাপনার মাধ্যমে উচ্চমানের ট্রেডিং সুযোগ সনাক্ত করার লক্ষ্যে তৈরি করা হয়েছে। যাইহোক, কৌশলটির পূর্ণ সম্ভাবনা অর্জনের জন্য ব্যবসায়ীদের ক্রমাগত পর্যালোচনা, অপ্টিমাইজেশন এবং সতর্কতা অবলম্বন করা প্রয়োজন।
/*backtest
start: 2025-01-01 00:00:00
end: 2025-03-30 00:00:00
period: 1h
basePeriod: 1h
exchanges: [{"eid":"Futures_Binance","currency":"ETH_USDT"}]
*/

if high > ta.highest(high[1], 5)
    strategy.entry("Enter Long", strategy.long)
else if low < ta.lowest(low[1], 5)
    strategy.entry("Enter Short", strategy.short)//@version=6
strategy("ThinkTech AI Signals", overlay=true, initial_capital=100000, default_qty_type=strategy.percent_of_equity, default_qty_value=100)

//──────────────────────────────
// Input Settings
//──────────────────────────────
riskRewardRatio    = input.float(title="Risk/Reward Ratio", defval=2.0, minval=1.0, step=0.1)

// Inputs from second script
liquidity_period   = input.int(20, title="Liquidity Base Period")
atr_length         = input.int(14, title="ATR Length")
atr_threshold      = input.float(0.3, title="ATR Breakout Threshold")
take_profit_mult   = input.float(0.25, title="Take-Profit Multiplier")
stop_loss_mult     = input.float(0.75, title="Stop-Loss Multiplier")
vol_filter         = input.bool(true, title="Enable Volume Filter")
session_filter     = input.bool(true, title="Limit to Trading Session")

// Additional inputs for further filtering and settings
atrMultiplier      = input.float(title="ATR Multiplier for Stop Loss", defval=1.5, minval=0.1, step=0.1)
retestCushionLong  = input.float(title="Retest Cushion Factor for BUY", defval=1.0, minval=1.0, step=0.001)
retestCushionShort = input.float(title="Retest Cushion Factor for SELL", defval=1.0, minval=0.0, maxval=1.0, step=0.001)
useTrendFilter     = input.bool(title="Use 50 EMA Trend Filter", defval=true)
useRSIFilter       = input.bool(title="Use RSI Filter", defval=false)
rsiPeriod          = input.int(title="RSI Period", defval=14, minval=1)
rsiOversold        = input.float(title="RSI Oversold Level", defval=30.0, minval=1, maxval=50)
rsiOverbought      = input.float(title="RSI Overbought Level", defval=70.0, minval=50, maxval=100)

// Option to remove plotted lines
showLiquidityLines   = input.bool(true, title="Show Liquidity Lines")
showFirstCandleLines = input.bool(true, title="Show First Candle Level Lines")

//──────────────────────────────
// Calculations & Variables (Liquidity & ATR Based)
//──────────────────────────────
price        = close
atr          = ta.atr(atr_length)
vol_condition = volume > ta.sma(volume, 20)

// Define Liquidity Base and Apex for support/resistance
liquidity_base = ta.lowest(low, liquidity_period)
apex           = ta.highest(high, liquidity_period)
// Track recent highs and lows for filtering
hh = ta.highest(high, 30)
ll = ta.lowest(low, 30)

//──────────────────────────────
// Trade Stats Variables
//──────────────────────────────
var float take_profit = na
var float stop_loss   = na
var bool  in_trade    = false
var int   win_count   = 0
var int   loss_count  = 0

//──────────────────────────────
// ENTRY LOGIC (BUY) Based on Liquidity & ATR
//──────────────────────────────
breakout_up      = price > liquidity_base + (atr * atr_threshold)
point_of_release = ta.crossover(price, liquidity_base) and breakout_up
retest_buy       = price > liquidity_base and price < hh and not in_trade

// Session condition (e.g. trading between 9AM–12PM)
session_condition = (hour >= 9 and hour <= 12) or not session_filter

if (point_of_release or retest_buy) and (vol_condition or not vol_filter) and session_condition
    strategy.entry("Buy", strategy.long)
    take_profit := price + (atr * take_profit_mult)
    stop_loss   := liquidity_base - (atr * stop_loss_mult)
    in_trade    := true
    alert("Buy Signal - Price: " + str.tostring(price), alert.freq_once_per_bar)

//──────────────────────────────
// ENTRY LOGIC (SELL) Based on Liquidity & ATR
//──────────────────────────────
breakout_down = price < apex - (atr * atr_threshold)
clean_break   = ta.crossunder(price, apex) and breakout_down
retest_sell   = price < apex and price > ll and not in_trade

if (clean_break or retest_sell) and (vol_condition or not vol_filter) and session_condition
    strategy.entry("Sell", strategy.short)
    take_profit := price - (atr * take_profit_mult)
    stop_loss   := apex + (atr * stop_loss_mult)
    in_trade    := true
    alert("Sell Signal - Price: " + str.tostring(price), alert.freq_once_per_bar)

//──────────────────────────────
// EXIT LOGIC (For BUY & SELL)
//──────────────────────────────
if strategy.position_size > 0
    if price >= take_profit
        strategy.close("Buy", comment="Take Profit")
        win_count += 1
        in_trade := false
    if price <= stop_loss
        strategy.close("Buy", comment="Stop Loss")
        loss_count += 1
        in_trade := false

if strategy.position_size < 0
    if price <= take_profit
        strategy.close("Sell", comment="Take Profit")
        win_count += 1
        in_trade := false
    if price >= stop_loss
        strategy.close("Sell", comment="Stop Loss")
        loss_count += 1
        in_trade := false

//──────────────────────────────
// Plot Liquidity Lines (Support/Resistance)
//──────────────────────────────
plot(showLiquidityLines ? liquidity_base : na, color=color.green, title="Liquidity Base (Support)")
plot(showLiquidityLines ? apex : na, color=color.red, title="Apex (Resistance)")

//──────────────────────────────
// Debugging Signal Shapes
//──────────────────────────────
plotshape(series=point_of_release, location=location.belowbar, color=color.green, style=shape.triangleup, title="Buy Signal")
plotshape(series=clean_break, location=location.abovebar, color=color.red, style=shape.triangledown, title="Sell Signal")

//──────────────────────────────
// Win/Loss Table Display
//──────────────────────────────
var table t = table.new(position.top_right, 1, 2)
if bar_index == last_bar_index
    table.cell(t, 0, 0, "Wins: " + str.tostring(win_count), bgcolor=color.new(color.green, 80))
    table.cell(t, 0, 1, "Losses: " + str.tostring(loss_count), bgcolor=color.new(color.red, 80))

//──────────────────────────────
// Alert Conditions for Entries and Exits
//──────────────────────────────
alertcondition(point_of_release, title="Buy Alert", message="Buy Signal Triggered")
alertcondition(clean_break, title="Sell Alert", message="Sell Signal Triggered")
var int lastClosedTrades = 0
var bool exitSignal = false
if strategy.closedtrades > lastClosedTrades
    exitSignal := true
    lastClosedTrades := strategy.closedtrades
alertcondition(exitSignal, title="EXIT Signal", message="EXIT signal triggered: Trade has closed (TP or SL reached).")

//──────────────────────────────
// FIRST 15-MINUTE CANDLE CAPTURE (9:30–9:45 AM EST)
//──────────────────────────────
newDay = dayofmonth != dayofmonth[1]
var float fHigh = na
var float fLow  = na
var bool  firstCandleCaptured = false
if newDay
    fHigh := high
    fLow  := low
    firstCandleCaptured := true

//──────────────────────────────
// Additional Filters & Calculations
//──────────────────────────────
// Trend Filter: 50 EMA
ema50       = ta.ema(close, 50)
longFilter  = not useTrendFilter or (close > ema50)
shortFilter = not useTrendFilter or (close < ema50)

// ATR-Based Stop Loss Buffer
atrValue       = ta.atr(14)
stopLossBuffer = atrValue * atrMultiplier

// RSI Calculation (if enabled)
rsiValue = ta.rsi(close, rsiPeriod)

//──────────────────────────────
// ENTRY CONDITIONS (15-Minute Candle Retest)
//──────────────────────────────
// Breakout/Breakdown based on the first candle levels
buyBreakout   = firstCandleCaptured and ta.crossover(close, fHigh)
sellBreakdown = firstCandleCaptured and ta.crossunder(close, fLow)
// Retest conditions: price must retest the level after the breakout/breakdown
buyRetest  = firstCandleCaptured and (low <= fHigh) and (close > fHigh)
sellRetest = firstCandleCaptured and (high >= fLow) and (close < fLow)
// Final entry signals (with optional RSI filter)
buySignal  = buyBreakout and buyRetest and longFilter and (strategy.position_size == 0) and (not useRSIFilter or (rsiValue < rsiOversold))
sellSignal = sellBreakdown and sellRetest and shortFilter and (strategy.position_size == 0) and (not useRSIFilter or (rsiValue > rsiOverbought))

//──────────────────────────────
// Trade Parameters for 15-Minute Candle Retest
//──────────────────────────────
candleRange    = fHigh - fLow
stopLossBuy    = fLow - stopLossBuffer
takeProfitBuy  = fHigh + (candleRange * riskRewardRatio)
stopLossSell   = fHigh + stopLossBuffer
takeProfitSell = fLow - (candleRange * riskRewardRatio)

//──────────────────────────────
// Execute Trades for 15-Minute Candle Retest
//──────────────────────────────
if buySignal
    strategy.entry("BUY", strategy.long)
    strategy.exit("TP/SL BUY", "BUY", stop=stopLossBuy, limit=takeProfitBuy)

if sellSignal
    strategy.entry("SELL", strategy.short)
    strategy.exit("TP/SL SELL", "SELL", stop=stopLossSell, limit=takeProfitSell)

//──────────────────────────────
// Plot First Candle Level Lines (Optional)
//──────────────────────────────
plot(showFirstCandleLines and firstCandleCaptured ? fHigh : na, title="First Candle High", color=color.blue, linewidth=2)
plot(showFirstCandleLines and firstCandleCaptured ? fLow : na, title="First Candle Low", color=color.red, linewidth=2)