পরিমাণগত দীর্ঘ এবং সংক্ষিপ্ত ট্রেন্ড ট্র্যাকিং গতিশীল স্টপ লস কৌশল

2
Follow
478
Followers
ওভারভিউ
এটি একটি মাল্টি-হোল ট্রেন্ড ট্র্যাকিং কৌশল যা গড় বাস্তব ওঠানামার পরিসীমা (ATR) এবং সূচকীয় চলমান গড় (EMA) এর উপর ভিত্তি করে। কৌশলটি গতিশীল স্টপ লস এবং প্রবণতা বিচার করে বাজারের প্রবণতাকে সঠিকভাবে ক্যাপচার এবং ঝুঁকি পরিচালনার জন্য।
কৌশল নীতি
এই কৌশলটির মূল নীতিমালায় নিম্নলিখিত মূল পদক্ষেপগুলি অন্তর্ভুক্ত রয়েছেঃ
- এটিআর ব্যবহার করে গতিশীল স্টপ লস গণনা করুন
- EMA-এর সাথে একত্রে দামের প্রবণতা নির্ধারণ
- দাম ও স্টপ লস পয়েন্টের মধ্যে সম্পর্কিত অবস্থান দ্বারা ট্রেডিং সিগন্যাল নির্ধারণ করা
- Heikin Ashi মানচিত্র ব্যবহার করে নির্বাচিত অপ্টিমাইজেশান সংকেত সনাক্তকরণ
প্রধান কম্পিউটিং লজিকঃ
- ডায়নামিক স্টপ লস = বর্তমান মূল্য ± (এটিআর * সংবেদনশীল ফ্যাক্টর)
- EMA এবং স্টপ লস পয়েন্টের উপর ভিত্তি করে প্রবণতা নির্ধারণ
- যখন দাম স্টপ লস পয়েন্ট অতিক্রম করে এবং ইএমএ অতিক্রম করে তখন একটি লেনদেনের সংকেত উত্পন্ন হয়
কৌশলগত সুবিধা
- গতিশীল ঝুঁকি ব্যবস্থাপনাঃ এটিআর স্বয়ংক্রিয়ভাবে স্টপ লস গণনা করে এবং বাজারের অস্থিরতার সাথে রিয়েল-টাইমে সামঞ্জস্য করে
- ট্রেন্ড ট্র্যাকিং নির্ভুলতাঃ ইএমএ দ্রুত মূল্য পরিবর্তনের প্রতিক্রিয়া জানায়, ট্রেন্ডের বিপর্যয় চিহ্নিত করে
- নমনীয়তাঃ কাস্টমাইজযোগ্য এটিআর চক্র এবং সংবেদনশীলতা
- ইচ্ছাকৃত হাইকেন-আচিন মানচিত্র, সংকেত সনাক্তকরণ আরও উন্নত করে
- নিম্ন-প্রবাহের লেনদেন, কম লেনদেনের খরচ
- একাধিক বাজার এবং বিভিন্ন জাতের জন্য উপযুক্ত
কৌশলগত ঝুঁকি
- বাজারের অস্থিরতার ফলে বারবার ভুল সংকেত আসতে পারে
- অপ্রয়োজনীয় প্যারামিটার সেট করলে অতিরিক্ত লেনদেন হতে পারে
- মৌলিক বিষয় এবং অপ্রত্যাশিত ঘটনার প্রভাব বিবেচনা করা হয়নি
- রিপিট এবং রিয়েল ডিস্কের মধ্যে কিছু পার্থক্য রয়েছে
ঝুঁকি নিয়ন্ত্রণের পরামর্শ:
- অপ্টিমাইজেশান প্যারামিটার, সংবেদনশীলতা হ্রাস
- অন্যান্য সূচকের সাথে মিলিত
- স্টপ লস এবং পজিশন ম্যানেজমেন্ট সেট করুন
- ক্রমাগত পর্যবেক্ষণ এবং গতিশীলতা
কৌশল অপ্টিমাইজেশনের দিকনির্দেশনা
- মেশিন লার্নিং অ্যালগরিদমের গতিশীল অপ্টিমাইজেশান প্যারামিটারগুলি প্রবর্তন করা
- মাল্টি-টাইম সাইকেল যাচাইকরণ যুক্ত করুন
- অন্যান্য প্রযুক্তিগত সূচক সমন্বয়
- একটি স্বনির্ধারিত প্যারামিটার নির্বাচন প্রক্রিয়া বিকাশ
- ঝুঁকি সমন্বয় মডিউল যোগ করুন
অপ্টিমাইজেশান লক্ষ্যঃ কৌশলগত স্থিতিশীলতা বৃদ্ধি, প্রত্যাহার হ্রাস, লাভজনকতা বৃদ্ধি
সারসংক্ষেপ
এটি একটি গতিশীল ট্রেন্ড ট্র্যাকিং কৌশল যা এটিআর এবং ইএমএ-এর উপর ভিত্তি করে, নমনীয় স্টপ লস এবং প্রবণতা বিচারের মাধ্যমে তুলনামূলকভাবে স্থিতিশীল বাজারে অংশগ্রহণের জন্য। কৌশলটি ভাল অভিযোজনযোগ্যতা এবং ঝুঁকি ব্যবস্থাপনার বৈশিষ্ট্য রয়েছে, তবে এটির ক্রমাগত অপ্টিমাইজেশন এবং যাচাইকরণের প্রয়োজন রয়েছে।
Source
Pine
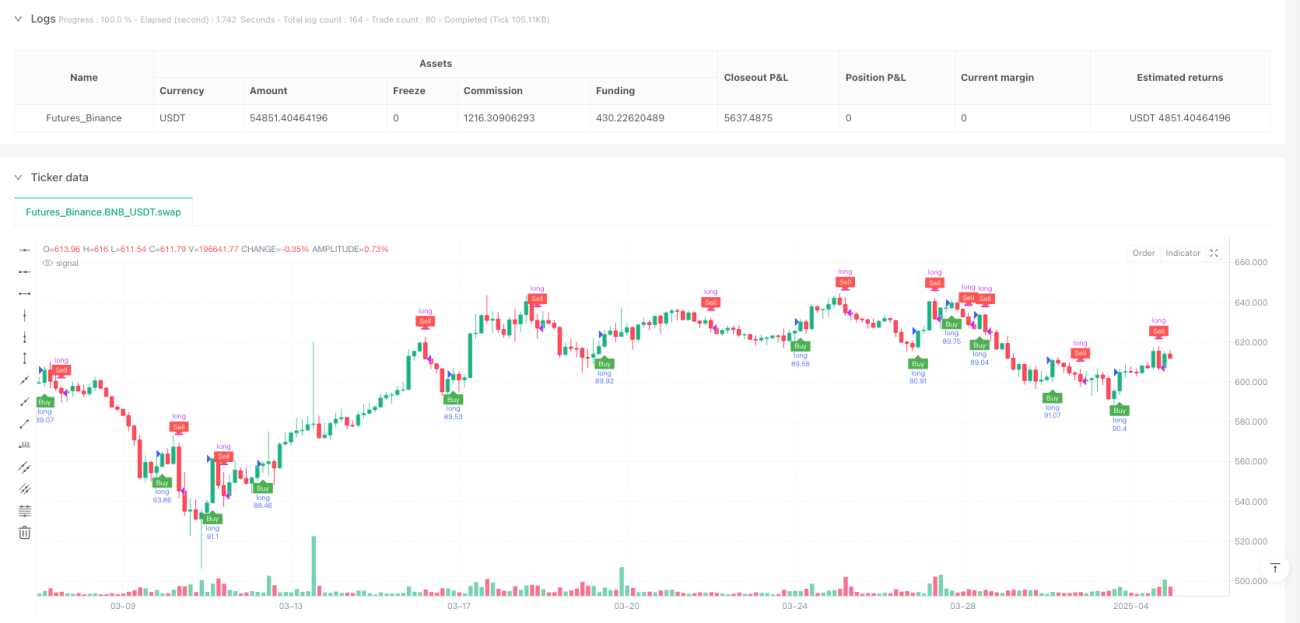
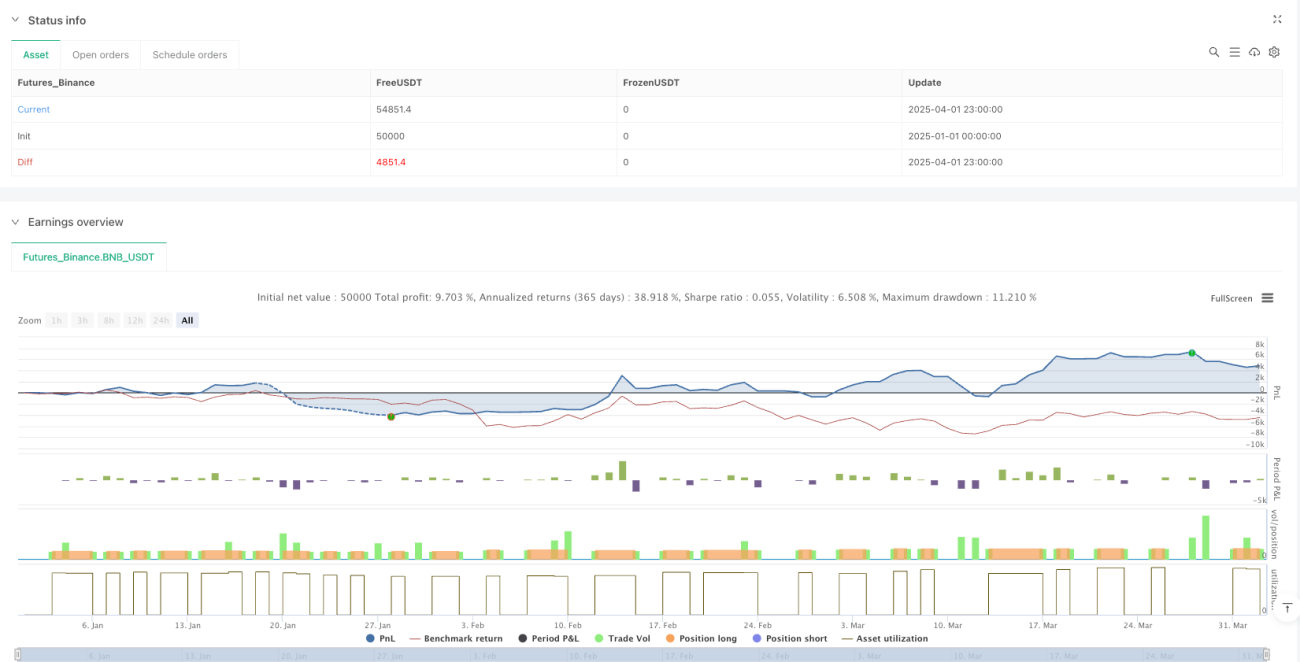
/*backtest
start: 2025-01-01 00:00:00
end: 2025-04-02 00:00:00
period: 3h
basePeriod: 3h
exchanges: [{"eid":"Futures_Binance","currency":"BNB_USDT"}]
*/

//@version=6
strategy("ducanhmaster v1", overlay=true, commission_type=strategy.commission.percent, commission_value=0.1, slippage=3, default_qty_type=strategy.percent_of_equity, default_qty_value=100)

// InputsStrategy parameters
Related strategies
Comment
All comments (0)
No data
- 1