
🚀 এই স্ট্র্যাটেজিটি আসলে কতটা শক্তিশালী?
আপনি কি জানেন? এই স্ট্র্যাটেজিটি আপনার ট্রেডিংয়ের জন্য একটা "আগুনের চোখ" হিসেবে কাজ করে! এটি বিশেষভাবে ১ মিনিট এবং ৫ মিনিটের আল্ট্রা-শর্ট-টার্ম ট্রেডিংয়ের জন্য ডিজাইন করা হয়েছে, যেখানে পাঁচটি সবচেয়ে শক্তিশালী টেকনিক্যাল ইন্ডিকেটর একসাথে ব্যবহার করা হয়েছে: ফাস্ট ও স্লো EMA, RSI, MACD, বলিঞ্জার ব্যান্ড এবং ভলিউম ফিল্টার। সহজ ভাষায় বলতে গেলে, এটি আপনাকে বাজারের প্রতিটি ছোট ওঠানামায় সঠিক সুযোগ ধরতে সাহায্য করে!
💡 গুরুত্বপূর্ণ পয়েন্ট! এই কম্বো পাঞ্চ কিভাবে কাজ করে?
কল্পনা করুন, এই স্ট্র্যাটেজিটি একজন অত্যন্ত কঠোর "ইন্টারভিউয়ার" এর মতো, যেখানে শুধুমাত্র সেই ট্রেডিং সুযোগগুলিই নির্বাচিত হয় যা একাধিক শর্ত পূরণ করে:
লং সিগন্যালের জন্য শর্ত পূরণ করতে হবে: দাম ফাস্ট EMA-এর উপরে থাকতে হবে, MACD গোল্ডেন ক্রস এবং পজিটিভ হতে হবে, বলিঞ্জার ব্যান্ডের উপরের রেখা ভেঙে যেতে হবে, RSI ৫০-৮০-এর মধ্যে থাকতে হবে এবং পর্যাপ্ত ভলিউম থাকতে হবে। এটি ঠিক তেমনই, যেন একজন ব্যক্তির একসাথে সুন্দর চেহারা, মেধা এবং ভালো চরিত্র থাকা প্রয়োজন!
শর্ট সিগন্যাল উল্টো: সব শর্তই বিপরীতভাবে পূরণ করতে হবে, যাতে প্রতিটি ট্রেডের পিছনে পর্যাপ্ত টেকনিক্যাল ভিত্তি থাকে।
⚡ ভুল এড়ানোর গাইড: কেন আল্ট্রা-শর্ট-টার্ম বেছে নেবেন?
এই স্ট্র্যাটেজিটির সবচেয়ে চমৎকার দিক হল এর রিস্ক কন্ট্রোল! স্টপ-লস সেট করা আছে ০.৫% এবং টেক-প্রফিট ১.০%-এ, যার ফলে রিস্ক-রিওয়ার্ড রেশিও ১:২। এটি ঠিক "ছোট বাজি, আনন্দ" – প্রতিবার লোকসান খুব ছোট, কিন্তু লাভ দ্বিগুণ হতে পারে!
এছাড়াও এটির একটি চমৎকার ডিজাইন রয়েছে: ১ মিনিটের চার্টে ক্যান্ডেলস্টিক প্যাটার্ন শনাক্তকরণ স্বয়ংক্রিয়ভাবে বন্ধ হয়ে যায়, কারণ আল্ট্রা-শর্ট-টার্মে ক্যান্ডেলের প্যাটার্নে অনেক নয়েজ থাকে, যা ভুল সিদ্ধান্ত নিতে পারে। এটি ঠিক কোলাহলপূর্ণ পরিবেশে স্বয়ংক্রিয় নয়েজ ক্যানসেলেশনের মতো স্মার্ট!
🎯 বাস্তব প্রয়োগ: এই স্ট্র্যাটেজিটি আপনার কী সমস্যা সমাধান করতে পারে?
যাদের জন্য উপযুক্ত: যারা ক্রিপ্টোকারেন্সি বাজারে ডে-ট্রেডিং করতে চান, বিশেষ করে যারা ছোট ছোট কিন্তু ঘন ঘন ট্রেডের মাধ্যমে মুনাফা জমা করতে চান।
যে সমস্যার সমাধান করে: একক ইন্ডিকেটরের মিথ্যা সিগন্যালের ঝামেলা দূর করে! মাল্টিপল কনফার্মেশন মেকানিজমের মাধ্যমে সিগন্যালের নির্ভরযোগ্যতা অনেক বেড়ে যায়। একইসাথে, কঠোর রিস্ক কন্ট্রোলের কারণে ভুল সিদ্ধান্ত হলেও লোকসান নিয়ন্ত্রণে থাকে।
মনে রাখবেন, এই স্ট্র্যাটেজিটি একটি নির্ভুল সার্জিকাল ছুরির মতো, যা উচ্চ লিকুইডিটি সম্পন্ন ক্রিপ্টো পেয়ারে সবচেয়ে ভালো কাজ করে। ভালো মানি ম্যানেজমেন্টের সাথে মিলিয়ে এটি আপনার ট্রেডিং অস্ত্রাগারের একটি কার্যকরী হাতিয়ার হয়ে উঠবে!
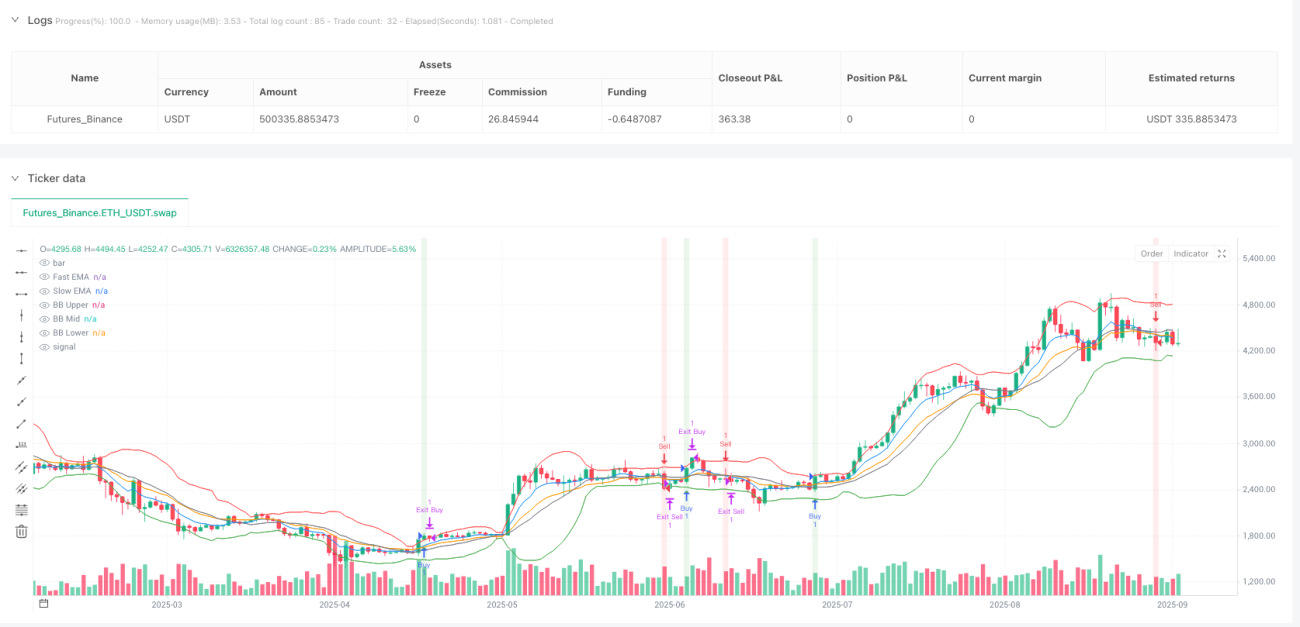
/*backtest
start: 2024-09-08 00:00:00
end: 2025-09-06 08:00:00
period: 1d
basePeriod: 1d
exchanges: [{"eid":"Futures_Binance","currency":"ETH_USDT","balance":500000}]
*/

//@version=5
strategy("Advanced Crypto Scalping Strategy - 1 & 5 Min Charts", overlay=true, margin_long=100, margin_short=100)

// Inputs for customization (optimized for 1-min and 5-min timeframes)- 1