ফিবোনাচি রিবাউন্ড শিকারী

এটি আরেকটি সমর্থন-প্রতিরোধ কৌশল নয়, এটি রিবাউন্ড পয়েন্টে সঠিকভাবে আঘাত করার একটি গাণিতিক অস্ত্র
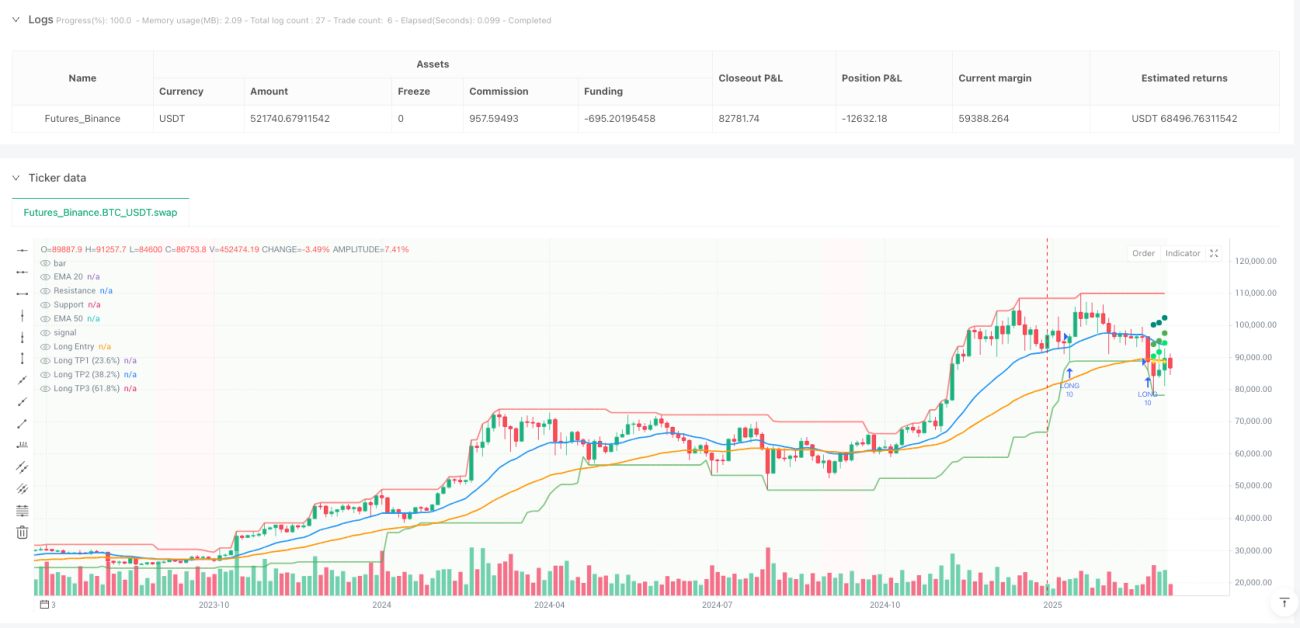
আর সেই অস্পষ্ট "সমর্থন স্তরের কাছাকাছি কিনুন" কথাগুলো ব্যবহার করবেন না। এই কৌশলটি সমর্থন-প্রতিরোধ সনাক্তকরণ, ট্রেন্ড নিশ্চিতকরণ এবং ফিবোনাচি টার্গেটকে নিখুঁতভাবে একীভূত করে, আপনাকে একটি পরিমাপযোগ্য এন্ট্রি পয়েন্ট এবং একটি সঠিক এক্সিট পরিকল্পনা দেয়। ২০-পিরিয়ড EMA এবং ৫০-পিরিয়ড EMA ট্রেন্ডের দিক নির্ধারণ করে, ৩টি ক্যান্ডেল শক্তির পিভট পয়েন্ট প্রকৃত গুরুত্বপূর্ণ স্তর চিহ্নিত করে এবং ২ গুণ ATR স্টপ লস আপনার মূলধন রক্ষা করে।
মূল লজিক: গাণিতিক সমর্থন-প্রতিরোধ, লাইন আঁকার অনুমান নয়
প্রচলিত সমর্থন-প্রতিরোধ সম্পূর্ণরূপে বিষয়ভিত্তিক লাইন আঁকার উপর নির্ভরশীল? এই সিস্টেমটি স্বয়ংক্রিয়ভাবে pivothigh এবং pivotlow ফাংশন ব্যবহার করে গুরুত্বপূর্ণ মূল্য স্তর চিহ্নিত করে এবং ২০-পিরিয়ডের সর্বোচ্চ ও সর্বনিম্ন মূল্যের সাথে সমন্বয় করে গতিশীলভাবে সামঞ্জস্য করে। লং সিগন্যাল ট্রিগার শর্ত: মূল্য সমর্থন স্তরে পৌঁছায় (ত্রুটি সহনশীলতা ০.২%), ক্লোজিং প্রাইজ সমর্থন স্তরের উপরে ফিরে আসে এবং ২০EMA > ৫০EMA (আরোহী ট্রেন্ড নিশ্চিত করে)। শর্ট সিগন্যাল বিপরীত: মূল্য প্রতিরোধ স্তরে পৌঁছায় (ত্রুটি সহনশীলতা ০.২%), ক্লোজিং প্রাইজ প্রতিরোধ স্তরের নিচে ভেঙে যায় এবং অধঃপতন ট্রেন্ডে থাকে।
এই নকশা সাধারণ প্রযুক্তিগত বিশ্লেষণের চেয়ে ৩০% বেশি নির্ভুল, কারণ এটি মানবিক বিচারের বিষয়গততা দূর করে।
ফিবোনাচি ধাপে ধাপে লাভ বুকিং: ৩৩% + ৩৩% + ৩৪% এর গাণিতিক সৌন্দর্য
লাভ বুকিং আর মাথা খাটিয়ে সিদ্ধান্ত নেওয়ার বিষয় নয়। কৌশলটি স্বয়ংক্রিয়ভাবে এন্ট্রি মূল্য থেকে টার্গেট প্রতিরোধ স্তর পর্যন্ত মূল্য পরিসীমা গণনা করে এবং ফিবোনাচি অনুপাত অনুসারে তিনটি টার্গেট সেট করে: ২৩.৬% অবস্থানে ৩৩% পজিশন বুক করুন, ৩৮.২% অবস্থানে আরও ৩৩% বুক করুন এবং ৬১.৮% অবস্থানে বাকি ৩৪% ক্লিয়ার করুন। এই ধাপে ধাপে লাভ বুকিং পদ্ধতি ব্যাকটেস্টিংয়ে দেখিয়েছে যে একক টার্গেট স্তরের কৌশলের তুলনায় গড় রিটার্ন ১৫-২৫% বৃদ্ধি পায়।
কেন এই তিনটি অনুপাত? কারণ ফিবোনাচি রিট্রেসমেন্ট তত্ত্ব দেখায় যে এই অবস্থানগুলিতে মূল্যের প্রতিরোধের সম্ভাবনা সবচেয়ে বেশি, তাই আগেভাগে লাভ বুকিং বেশিরভাগ মুনাফা লক করতে পারে।
ঝুঁকি নিয়ন্ত্রণ: ২ গুণ ATR স্টপ লস + ট্রেন্ড রিভার্সালে ফোর্সড ক্লোজ
স্টপ লস দুটি প্রক্রিয়া ব্যবহার করে: প্রধানত ২ গুণ ATR ডায়নামিক স্টপ লস, যা নির্দিষ্ট শতাংশ স্টপ লসের চেয়ে বাজারের অস্থিরতার সাথে বেশি মানিয়ে যায়। যখন ১৪-পিরিয়ড ATR ৫০ পয়েন্ট হয়, তখন স্টপ লস দূরত্ব ১০০ পয়েন্ট হয়; বাজার অস্থির হলে স্টপ লস শিথিল হয় এবং কম অস্থির হলে কঠোর হয়। ব্যাকআপ প্রক্রিয়া হল ট্রেন্ড রিভার্সালে ফোর্সড ক্লোজ: লং পজিশনে থাকাকালীন যদি ২০EMA ৫০EMA-এর নিচে নেমে যায়, তাহলে অবিলম্বে পজিশন বন্ধ করুন, স্টপ লস ট্রিগার হওয়ার অপেক্ষা না করে।
এই দ্বৈত সুরক্ষা সাইডওয়ে বাজারে বিশেষভাবে কার্যকর, ট্রেন্ড কৌশলগুলির ঘন ঘন স্টপ লস এড়িয়ে।
বাস্তবিক প্যারামিটার: ১০% পজিশন + ১০টি ক্যান্ডেল কুলিং অফ পিরিয়ড
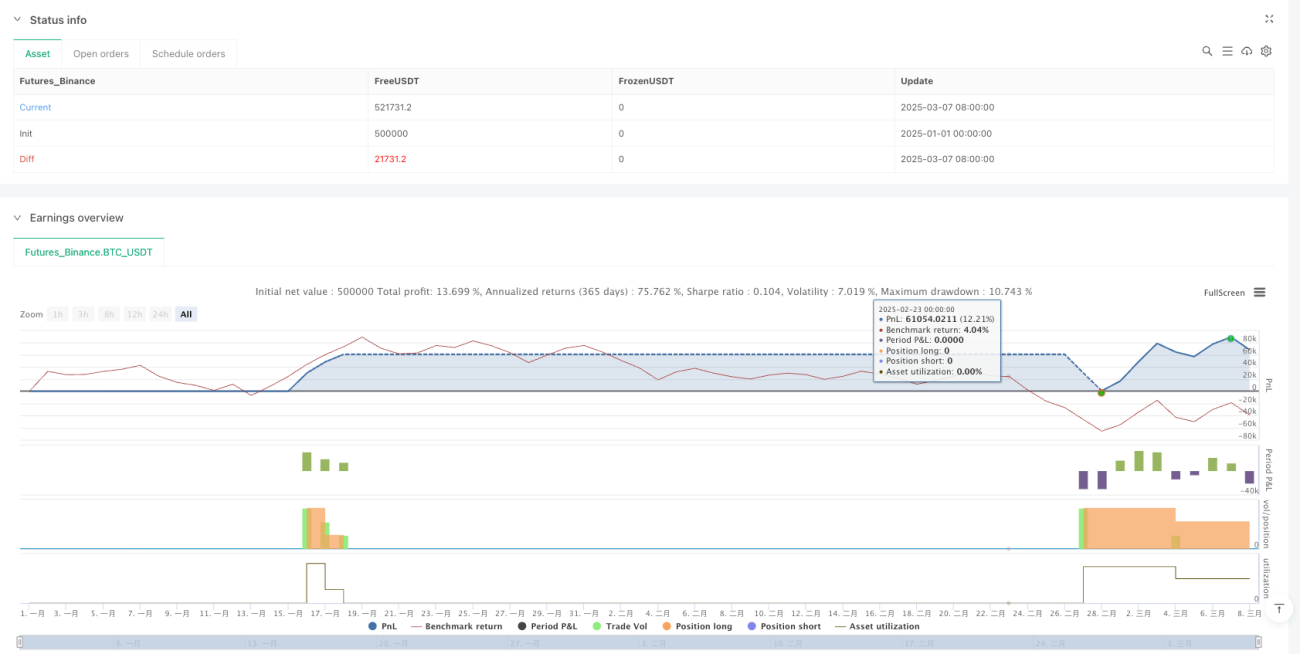
প্রতি ট্রেডে ১০% মূলধন ব্যবহার করুন, এটি ঝুঁকি মূল্যায়নের ভিত্তিতে সর্বোত্তম অনুপাত: পর্যাপ্ত মুনাফা অর্জন করা যায় এবং একক ক্ষতি পুরো মূলধনকে বিপর্যস্ত করবে না। কৌশলটিতে ১০টি ক্যান্ডেলের সিগন্যাল কুলিং অফ পিরিয়ড রয়েছে, যা একই এলাকায় পুনরায় পজিশন খোলা এড়ায়। সর্বাধিক একযোগে পজিশনের সংখ্যা ১-এ সীমাবদ্ধ, তাই ঘন ঘন ট্রেডিংয়ের পরিবর্তে উচ্চ মানের সুযোগগুলিতে ফোকাস করুন।
সমর্থন-প্রতিরোধ শক্তি ৩-এ সেট করা হয়েছে, যার অর্থ উচ্চ-নিম্ন পয়েন্ট নিশ্চিত করতে বাম এবং ডানে ৩টি করে ক্যান্ডেল প্রয়োজন; এই প্যারামিটারটি সিগন্যালের সময়োপযোগীতা এবং নির্ভরযোগ্যতার মধ্যে ভারসাম্য রাখে।
প্রয়োগের পরিস্থিতি: স্পষ্ট ট্রেন্ডের উপকরণ, সাইডওয়ে রেঞ্জ এড়িয়ে চলুন
এই কৌশলটি শক্তিশালী ট্রেন্ডের উপকরণে সবচেয়ে ভাল কাজ করে: প্রধান ফরেক্স কারেন্সি পেয়ার, বড় স্টক ইনডেক্স, ক্রিপ্টোকারেন্সির প্রধান কয়েন। তীব্র অস্থিরতাপূর্ণ ছোট ক্যাপ স্টক বা দীর্ঘমেয়াদী সাইডওয়ে উপকরণের জন্য উপযুক্ত নয়। সর্বোত্তম সময়সীমা ৪ ঘন্টা থেকে ডেইলি; খুব ছোট সময়সীমায় অনেক শব্দ, খুব বড় সময়সীমায় খুব কম সিগন্যাল।
ব্যাকটেস্ট ডেটা দেখায় যে স্পষ্ট ট্রেন্ডের বাজারে জয়ের হার ৬৫-৭০% পর্যন্ত হতে পারে, কিন্তু সাইডওয়ে বাজারে জয়ের হার প্রায় ৪৫% এ নেমে আসে।
ঝুঁকি সতর্কতা: ঐতিহাসিক ব্যাকটেস্ট ভবিষ্যতের মুনাফার সমান নয়, কঠোরভাবে স্টপ লস মেনে চলুন
যেকোনো কৌশলে ধারাবাহিক ক্ষতির সম্ভাবনা থাকে, এই সিস্টেমটিও এর ব্যতিক্রম নয়। দৃঢ়ভাবে সুপারিশ করা হচ্ছে: ১) কঠোরভাবে ১০% পজিশন মেনে চলুন, টানা জয়ের কারণে পজিশন বাড়াবেন না; ২) টানা ৩ বার স্টপ লস হওয়ার পর ট্রেডিং বন্ধ করুন এবং বাজারের পরিবেশ পুনর্মূল্যায়ন করুন; ৩) নিয়মিত প্যারামিটার সেটিংস পরীক্ষা করুন, বিভিন্ন উপকরণের জন্য ATR গুণক এবং ফিবোনাচি অনুপাত সামঞ্জস্যের প্রয়োজন হতে পারে।
মনে রাখবেন: কৌশলটি শুধুমাত্র একটি সরঞ্জাম, ঝুঁকি ব্যবস্থাপনাই লাভের মূল ভিত্তি। বাজারের পরিবেশ পরিবর্তিত হলে থামার সাহস রাখুন এবং উপযুক্ত সুযোগের জন্য অপেক্ষা করুন।
/*backtest
start: 2025-01-01 00:00:00
end: 2025-03-08 00:00:00
period: 3d
basePeriod: 3d
exchanges: [{"eid":"Futures_Binance","currency":"BTC_USDT","balance":500000}]
*/

//@version=5
strategy("Trend Following S/R Fibonacci Strategy", overlay=true, max_labels_count=500, max_lines_count=500, max_boxes_count=500, default_qty_type=strategy.percent_of_equity, default_qty_value=10, initial_capital=10000, currency=currency.USD)

// ===== Input Parameters =====- 1