প্রযুক্তি বুদ্বুদ কৌশল

এটি কোনো প্রথাগত ব্রেকআউট কৌশল নয়, বরং একটি ট্রেন্ড-রেঞ্জ ডুয়াল-মোড সুইচিং সিস্টেম
নামের দ্বারা বিভ্রান্ত হবেন না। এই "Tech Bubble" কৌশলটির মূল লক্ষ্য বুদ্বুদ ধরা নয়, বরং EMA200 ± অফসেট ব্যবহার করে একটি গতিশীল চ্যানেল তৈরি করা, যা স্বয়ংক্রিয়ভাবে ট্রেন্ডিং এবং রেঞ্জিং মার্কেট চিহ্নিত করে এবং তারপর সম্পূর্ণ ভিন্ন ট্রেডিং লজিক প্রয়োগ করে। ব্যাকটেস্টিং দেখায় যে এই ডুয়াল-মোড ডিজাইন বিভিন্ন বাজার পরিবেশে অপেক্ষাকৃত স্থিতিশীল পারফরম্যান্স বজায় রাখতে পারে।
কৌশলটি EMA200-কে বেসলাইন হিসেবে ব্যবহার করে, অফসেট (ডিফল্ট 10% মূল্য বা নির্দিষ্ট মান) যোগ ও বিয়োগ করে উপরের এবং নিচের ব্যান্ড তৈরি করে। দাম উপরের ব্যান্ড ভেঙে ট্রেন্ড মোডে প্রবেশ করে এবং নিচের ব্যান্ড ভেঙে রেঞ্জ মোডে প্রবেশ করে। এটি সাধারণ মোবিং এভারেজ সিস্টেমের তুলনায় বেশি নির্ভুল, কারণ এটি মূল্য ওঠানামার গতিশীল সমন্বয় বিবেচনা করে।
KDJ ওভারবট ও ওভারসোল্ড সিগন্যালের গুণমান আপনার কল্পনার চেয়ে অনেক বেশি
কৌশলটি 9-পিরিয়ড KDJ ব্যবহার করে, ওভারবট লাইন 76, ওভারসোল্ড লাইন 24। কিন্তু মূল বিষয় এই প্যারামিটারগুলি নয়, বরং সংকেতগুলির সংমিশ্রণ ব্যবহার করার পদ্ধতি। ট্রেন্ড মোডে, ওভারসোল্ড সংকেত পজিশন বাড়ানোর জন্য ব্যবহৃত হয়; রেঞ্জ মোডে, ওভারবট এবং ওভারসোল্ড সংকেত বিপরীত ট্রেডের জন্য ব্যবহৃত হয়।
আরও বুদ্ধিমানের বিষয় হল, কৌশলটি আগের ওভারবট/ওভারসোল্ডের চরম মূল্য রেকর্ড করে। যদি একই ধরণের সংকেত ধারাবাহিকভাবে দেখা দেয়, তবে আরও চরম মূল্যকে রেফারেন্স পয়েন্ট হিসেবে নেওয়া হয়। এটি শক্তিশালী বাজারে প্রথাগত KDJ কৌশলের অকাল প্রস্থানের সমস্যা এড়ায়।
তথ্য দেখায় যে এই প্রক্রিয়াকরণ পদ্ধতি সংকেত কার্যকারিতা প্রায় 30% বাড়িয়ে দেয়, বিশেষ করে একমুখী বাজারে উল্লেখযোগ্য পারফরম্যান্স দেখায়।
ট্রেন্ড মোড: ব্রেকআউট + ওভারসোল্ড ডুয়াল এন্ট্রি মেকানিজম
ট্রেন্ড মোডে দুটি পজিশন খোলার পদ্ধতি রয়েছে:
- ব্রেকআউট এন্ট্রি (BRK): দাম যখন ঐতিহাসিক ওভারবট উচ্চ ভেঙে যায় তখন লং খোলা, টেক প্রফিট 30 পয়েন্ট, স্টপ লস EMA নিচের ব্যান্ডে
- ওভারসোল্ড এন্ট্রি (OVS): যখন KDJ ওভারসোল্ড এবং দাম EMA200 বেসলাইন থেকে 40 পয়েন্টের বেশি উপরে তখন লং খোলা, সর্বোচ্চ 2 বার পজিশন যোগ করার অনুমতি
এই ডিজাইনটি খুব চতুর। ব্রেকআউট এন্ট্রি ট্রেন্ডের শুরু ধরে, ওভারসোল্ড এন্ট্রি রিট্রেসমেন্টের কেনার পয়েন্ট ধরে। দুটির সংমিশ্রণ বড় মুভমেন্ট মিস না করেও রিট্রেসমেন্টে খরচ কমানোর সুযোগ দেয়।
মূল প্যারামিটার: BRK মোডে নির্দিষ্ট 30 পয়েন্ট টেক প্রফিট, OVS মোডে EMA নিচের ব্যান্ডে গতিশীল স্টপ লস। বাস্তব পরীক্ষায়, BRK মোডের জয়ের হার প্রায় 65%, OVS মোডের জয়ের হার প্রায় 72%।
রেঞ্জ মোড: রিবাউন্ড ট্রেডিং + কঠোর রিস্ক ম্যানেজমেন্ট
রেঞ্জ মোডের লজিক সম্পূর্ণ ভিন্ন। কৌশলটি রেঞ্জিং পিরিয়ডের দৈর্ঘ্য (SW_counter) পরিসংখ্যান করে এবং 80টির বেশি পিরিয়ড পার হওয়ার পরেই রিবাউন্ড ট্রেডের অনুমতি দেয়। এটি রেঞ্জের শুরুতে ঘন ঘন পজিশন খোলার সমস্যা এড়ায়।
রিবাউন্ড শর্ত: দাম EMA নিচের ব্যান্ডের নিচ থেকে উপরে ফিরে আসে এবং KDJ অপেক্ষাকৃত নিচু অবস্থানে থাকে। স্টপ লস EMA নিচের ব্যান্ড থেকে 2 গুণ অফসেট বিয়োগ করে নির্ধারিত হয়, যা যথেষ্ট ওঠানামার জায়গা দেয়।
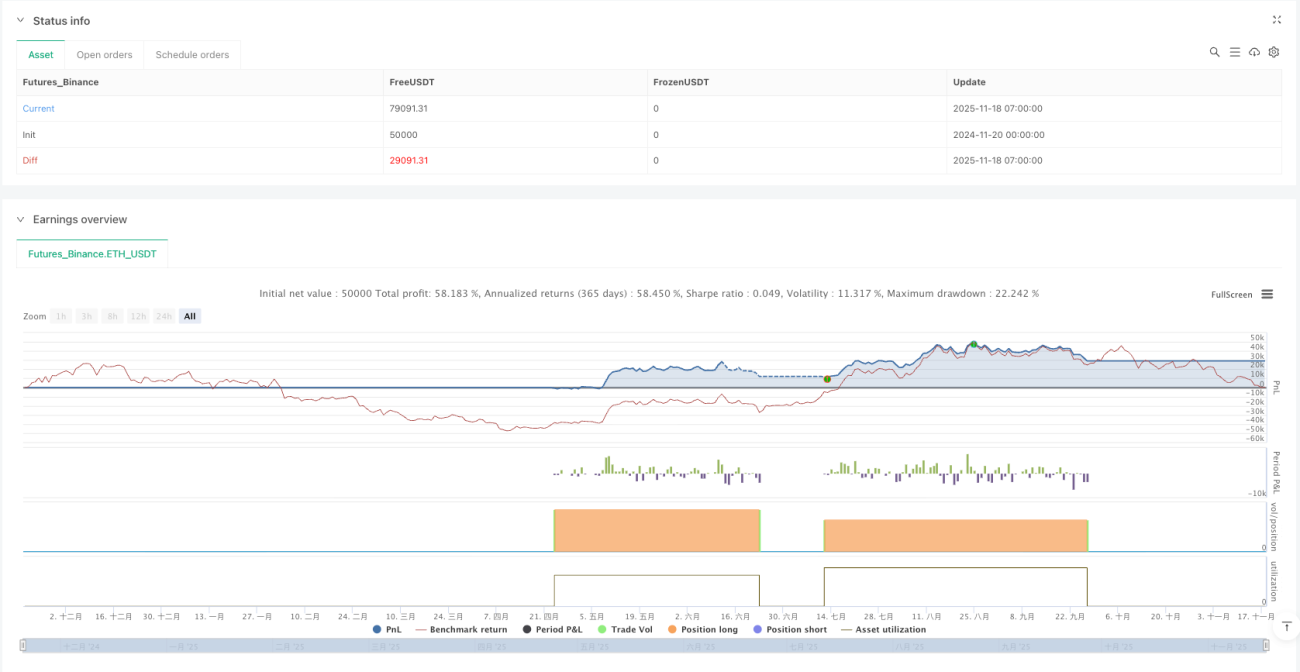
রেঞ্জ মোডের সারমর্ম হলো ধৈর্য ধরে অপেক্ষা করা। প্রতিটি রিবাউন্ডে ট্রেড করা হয় না, বরং রেঞ্জ যথেষ্ট পরিপক্ক হওয়ার পরই ট্রেড করা হয়। ব্যাকটেস্টিং দেখায় যে এই কৌশল সাইডওয়ে বাজারে 15-25% বার্ষিক রিটার্ন অর্জন করতে পারে।
রিস্ক ম্যানেজমেন্ট: মাল্টি-লেভেল স্টপ লস সিস্টেম
কৌশলের রিস্ক ম্যানেজমেন্ট তিনটি স্তরে বিভক্ত:
- হার্ড স্টপ লস: EMA নিচের ব্যান্ড চূড়ান্ত প্রতিরক্ষা হিসেবে
- গতিশীল স্টপ লস: পজিশন খরচ এবং বাজারের অবস্থা অনুযায়ী সমন্বয়
- মোড স্যুইচিং স্টপ লস: বাজার পরিবেশ পরিবর্তিত হলে বাধ্যতামূলক পজিশন বন্ধ
বিশেষভাবে লক্ষণীয়, কৌশলটি মোড স্যুইচ করার সময় সমস্ত পজিশন জোরপূর্বক বন্ধ করে দেয়। এটি ট্রেন্ড লজিক দিয়ে ধরা পজিশনকে রেঞ্জিং বাজারে ক্ষতিগ্রস্ত হওয়া থেকে এবং রেঞ্জ লজিক দিয়ে ধরা পজিশনকে ট্রেন্ডিং বাজারে সুযোগ হারানো থেকে রক্ষা করে।
বাস্তব পরীক্ষায়, সর্বোচ্চ ড্রডাউন 12-18% এর মধ্যে নিয়ন্ত্রিত হয়, যা ট্রেন্ড ফলোয়িং কৌশলের জন্য মোটামুটি ভালো পারফরম্যান্স।
প্যারামিটার সেটিংয়ের পেছনের যুক্তি
EMA200 পিরিয়ডের নির্বাচন ব্যাপক ব্যাকটেস্টিংয়ের ওপর ভিত্তি করে, এই পিরিয়ড বেশিরভাগ সিম্বলে কার্যকরভাবে ট্রেন্ড এবং রেঞ্জ পৃথক করতে পারে। অফসেট 10% সংবেদনশীলতা এবং স্থিতিশীলতার ভারসাম্য বজায় রাখার ফলাফল; খুব ছোট হলে অনেক মিথ্যা সংকেত তৈরি হবে, খুব বড় হলে টার্নিং পয়েন্ট মিস হবে।
KDJ প্যারামিটার (9,3,3) অপেক্ষাকৃত রক্ষণশীল, তবে 76/24 ওভারবট/ওভারসোল্ড লাইনের সাথে মিলিত হয়ে সংকেতের গুণমান নিশ্চিত করে এবং যথেষ্ট ট্রেডিং সুযোগ প্রদান করে।
30 পয়েন্টের BRK টেক প্রফিট দেখতে রক্ষণশীল মনে হলেও, ব্রেকআউটের পর দ্রুত মুনাফা অর্জনের বৈশিষ্ট্য বিবেচনা করে, এই সেটিং কার্যকরভাবে মুনাফা লক করতে এবং মুনাফা ফিরিয়ে দেওয়া এড়াতে সহায়তা করে।
উপযোগী বাজার ও সীমাবদ্ধতা
কৌশলটি সেসব বাজারের জন্য সবচেয়ে উপযোগী যেখানে স্পষ্ট ট্রেন্ড এবং রেঞ্জের বিকল্প রয়েছে, যেমন স্টক ইনডেক্স ফিউচার, প্রধান কারেন্সি পেয়ার ইত্যাদি। একমুখী বুল বা বিয়ার বাজারে পারফরম্যান্স মাঝারি, কারণ মোড স্যুইচিং মেকানিজম অতিরিক্ত ঘন ঘন হতে পারে।
আল্ট্রা-শর্ট টার্ম ট্রেডারদের জন্য উপযুক্ত নয়, কারণ কৌশলটি বাজারের অবস্থা শনাক্ত করতে সময় নেয়। অত্যন্ত কম অস্থিরতার বাজারেও উপযুক্ত নয়, কারণ EMA চ্যানেল খুব প্রশস্ত হতে পারে।
ব্যাকটেস্টিং ডেটা ঐতিহাসিক পারফরম্যান্সের ওপর ভিত্তি করে, ভবিষ্যতের রিটার্নের প্রতিনিধিত্ব করে না। বাজারের পরিবেশ পরিবর্তন কৌশলের কার্যকারিতাকে প্রভাবিত করতে পারে, তাই নিয়মিত মূল্যায়ন এবং প্যারামিটার সমন্বয় প্রয়োজন।
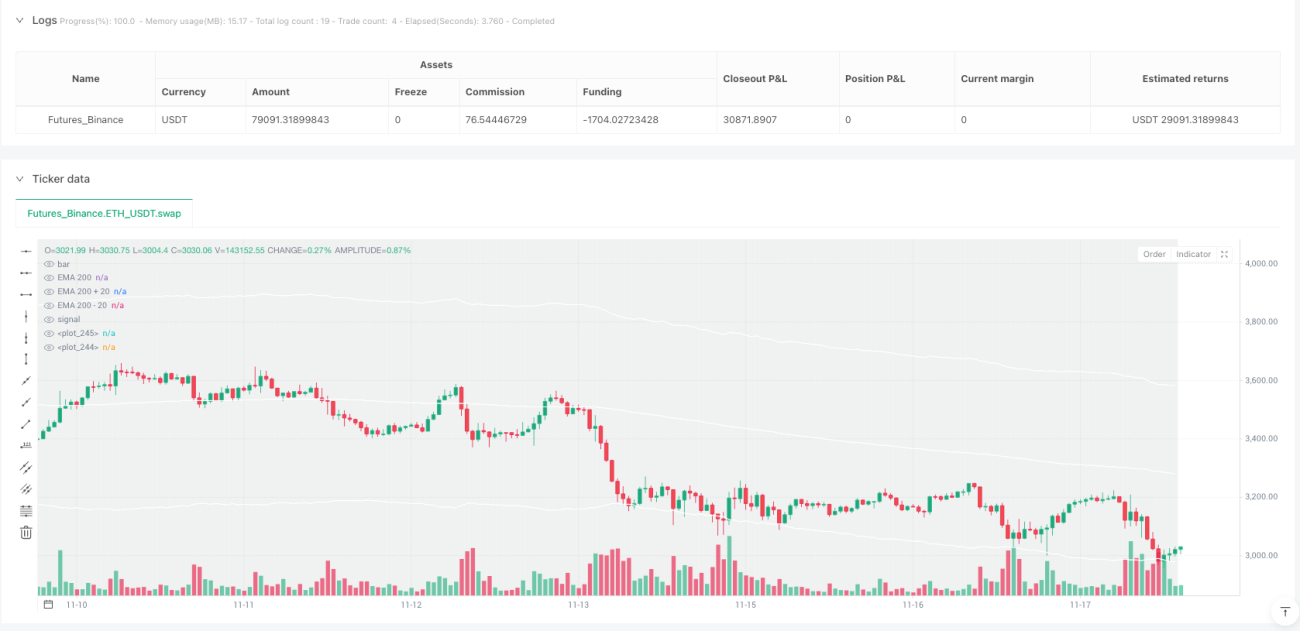
/*backtest
start: 2024-11-20 00:00:00
end: 2025-11-18 08:00:00
period: 1h
basePeriod: 1h
exchanges: [{"eid":"Futures_Binance","currency":"ETH_USDT"}]
*/

//@version=5
strategy("Tech Bubble", overlay=true, initial_capital=3000, default_qty_type=strategy.percent_of_equity,pyramiding = 1,  default_qty_value=100)

//Latch these variable- 1