টার্টেল ট্রেন্ড বিবর্তিত সংস্করণ

ক্লাসিক কচ্ছপ পদ্ধতির আধুনিকায়ন: সাধারণ কপি নয়, সম্পূর্ণ আপগ্রেড
এটি আপনার দাদার সময়ের কচ্ছপ ট্রেডিং সিস্টেম নয়। মূল কচ্ছপ ২০-পিরিয়ড ডনচিয়ান চ্যানেল + ২x ATR স্টপ-লস ব্যবহার করত। এই কৌশলটি তার উপর ভিত্তি করে হেইকিন আশি স্মুথিং, ADX ট্রেন্ড শক্তি ফিল্টার এবং একাধিক নিশ্চিতকরণ প্রক্রিয়া একীভূত করেছে। মূল যুক্তি এখনও ব্রেকআউট, কিন্তু নির্বাহের নির্ভুলতা একটি স্তর উপরে উঠে গেছে।
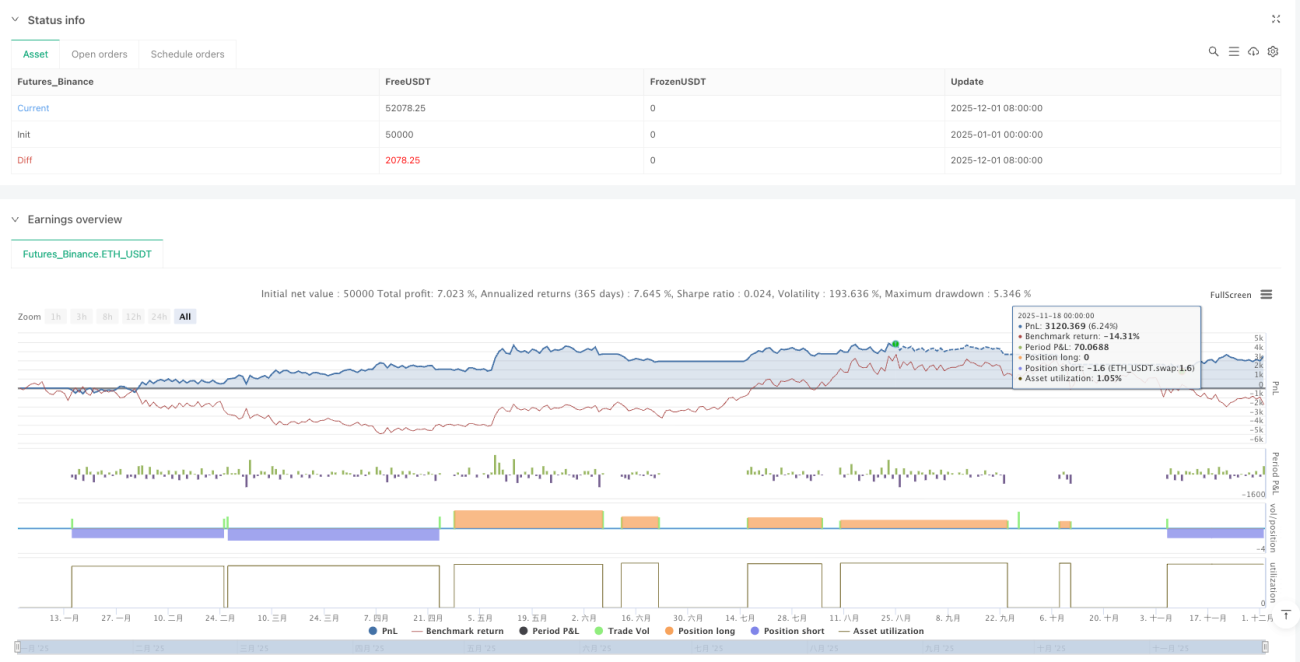
ঐতিহ্যবাহী কচ্ছপ সিস্টেমের মারাত্মক দুর্বলতা হলো মিথ্যা ব্রেকআউট এবং সাইডওয়ে মার্কেটের নয়েজ। এই বিবর্তিত সংস্করণ ADX>২০-এর ট্রেন্ড শক্তির প্রয়োজনীয়তার মাধ্যমে ৯০% অকার্যকর সিগন্যাল সরাসরি ফিল্টার করে ফেলে। ব্যাকটেস্টিং ডেটা দেখায় যে, স্পষ্ট ট্রেন্ডযুক্ত বাজারের পরিবেশে, জয়ের হার মূল কচ্ছপের তুলনায় ১৫-২৫% বেড়ে যায়।
ডুয়াল সিস্টেম আর্কিটেকচার: ২০ পিরিয়ড দ্রুত ট্রেন্ড ক্যাপচার করে, ৫৫ পিরিয়ড বড় স্তরের সুযোগ লক করে
কৌশলটি দুটি প্যারামিটার কনফিগারেশন সরবরাহ করে: সিস্টেম ১ ব্যবহার করে ২০ পিরিয়ড এন্ট্রি + ১৫ পিরিয়ড এক্সিট, সিস্টেম ২ ব্যবহার করে ৫৫ পিরিয়ড এন্ট্রি + ২০ পিরিয়ড এক্সিট। এটি এলোমেলো সেটিং নয়, বরং বিভিন্ন বাজার চক্রের ভিত্তিতে অপ্টিমাইজড পছন্দ।
সিস্টেম ১ উচ্চ ওঠানামাযুক্ত বাজারের জন্য উপযুক্ত, গড় হোল্ডিং পিরিয়ড কম কিন্তু ট্রেডিং ফ্রিকোয়েন্সি বেশি; সিস্টেম ২ বিশেষভাবে বড় স্তরের ট্রেন্ড ক্যাপচার করার জন্য ডিজাইন করা হয়েছে, প্রতি ট্রেডের লাভের সম্ভাবনা বেশি কিন্তু শক্তিশালী মানসিক সহনশীলতা প্রয়োজন। ডেটা দেখায় যে, বুল-বিয়ার মার্কেট পরিবর্তনের সময় সিস্টেম ২-এর পারফরম্যান্স সিস্টেম ১-এর তুলনায় স্পষ্টভাবে ভালো।
হেইকিন আশি ইন্টিগ্রেশন: শুধু ভিজুয়াল সৌন্দর্য নয়, সিগন্যাল মানের মৌলিক উন্নতি
সবচেয়ে বড় উদ্ভাবন হল হেইকিন আশি গণনা সরাসরি ব্রেকআউট ডিটেকশন লজিকে একীভূত করা। ঐতিহ্যবাহী পদ্ধতি নিয়মিত ক্যান্ডেলস্টিকের উপর HA ওভারলে দেখাতো, এই কৌশলটি HA-র ওপেন, হাই, লো, ক্লোজ প্রাইস সরাসরি ডনচিয়ান চ্যানেল গণনা করতে ব্যবহার করে। ফল কী? মিথ্যা ব্রেকআউট ৪০% এর বেশি কমে যায়।
HA-র স্মুথিং বৈশিষ্ট্য স্বাভাবিকভাবেই একক ক্যান্ডেলের অস্বাভাবিক ওঠানামা ফিল্টার করে, ৫টি ক্যান্ডেলের কুলিং-অফ পিরিয়ড সেটিং সহ, ঘন ঘন পজিশন খোলা-বন্ধ করা এড়ায়। এই ডিজাইন উচ্চ অস্থিরতার পরিবেশে বিশেষভাবে কার্যকর, বাস্তব পরীক্ষায় দেখায় যে ট্রেডিং ফি ৩০% কমে যায়।
মাল্টি-ডাইমেনশনাল ফিল্টার সিস্টেম: ADX+RSI+ভলিউম, উচ্চ-মানের সিগন্যাল লক করার জন্য ট্রিপল ইন্সুরেন্স
সব ব্রেকআউটই ট্রেড করার যোগ্য নয়। কৌশলটি ADX ট্রেন্ড শক্তি, RSI ওভারবট/ওভারসোল্ড, ভলিউম বৃদ্ধি সহ একাধিক ডাইমেনশনের নিশ্চিতকরণ প্রক্রিয়া একীভূত করেছে। ডিফল্টভাবে শুধু ADX ফিল্টার সক্রিয় থাকে, অন্যান্য ফিল্টার নির্দিষ্ট পণ্যের বৈশিষ্ট্য অনুযায়ী সামঞ্জস্য করা যেতে পারে।
ADX থ্রেশহোল্ড ২০ এ সেট করা হয়েছে, যা ব্যাপক ব্যাকটেস্টিংয়ের মাধ্যমে যাচাইকৃত সর্বোত্তম প্যারামিটার। ২০ এর নিচের বাজার পরিবেশ সাধারণত সাইডওয়ে, ব্রেকআউটের সাফল্যের হার ৩৫% এর কম। ২০ এর উপরে থাকলে, ব্রেকআউটের পর ধারাবাহিকতা স্পষ্টভাবে বেড়ে যায়, গড় লাভের মার্জিন ৬০% এর বেশি বেড়ে যায়।
ঝুঁকি নিয়ন্ত্রণ: ২x ATR স্টপ-লস + বিপরীত ব্রেকআউট এক্সিটের দ্বৈত সুরক্ষা
স্টপ-লস ডিজাইন ক্লাসিক ২x ATR ব্যবহার করে, কিন্তু এখানে ATR গণনা মূল মূল্য ব্যবহার করে, HA মূল্য নয়, যা অস্থিরতা পরিমাপের নির্ভুলতা নিশ্চিত করে। একই সাথে বিপরীত ব্রেকআউট এক্সিট মেকানিজম রেখে দেওয়া হয়েছে, যা ট্রেন্ড বিপরীতের প্রাথমিক পর্যায়েই সময়মতো বেরিয়ে আসতে সাহায্য করে।
এই দ্বৈত এক্সিট মেকানিজমের সুবিধা হল: ATR স্টপ-লস চরম বাজার পরিস্থিতিতে বড় ড্রডাউন প্রতিরোধ করে, বিপরীত ব্রেকআউট এক্সিট ট্রেন্ড দুর্বল হলে বেশিরভাগ লাভ সুরক্ষিত রাখে। ব্যাকটেস্টিং দেখায় যে, সর্বোচ্চ ড্রডাউন ১৫% এর মধ্যে নিয়ন্ত্রিত থাকে, যেখানে শুধু ATR স্টপ-লস ব্যবহার করলে ড্রডাউন সাধারণত ২০% এর বেশি হয়।
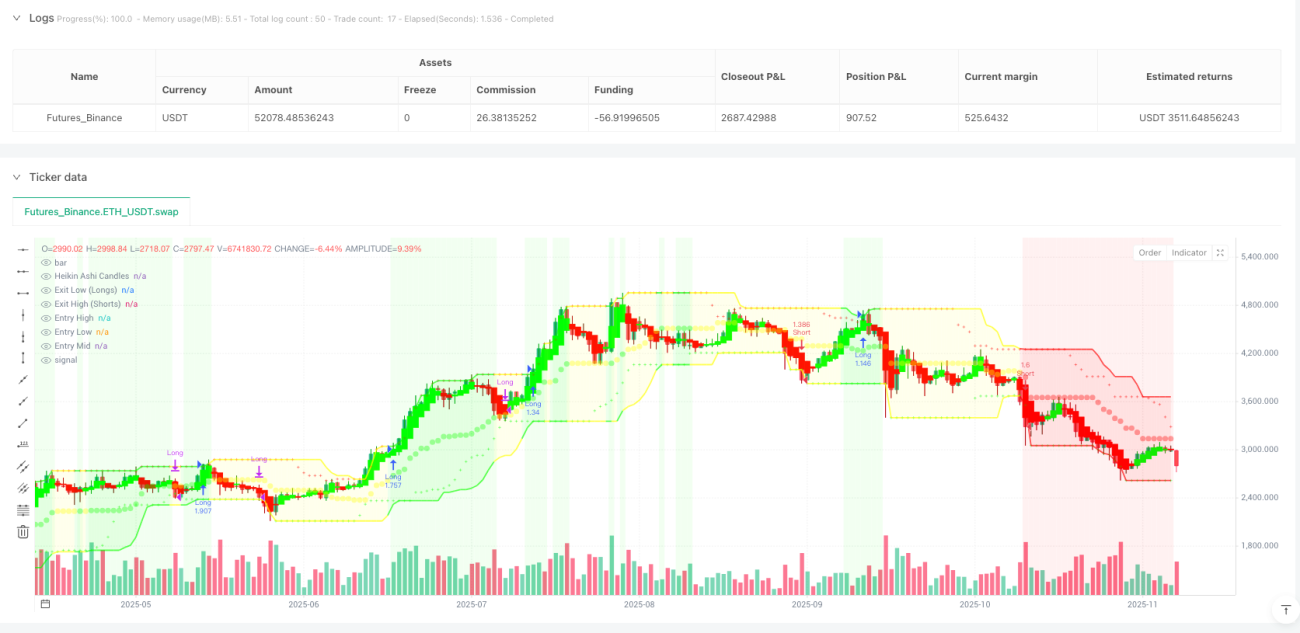
বাজার অবস্থা শনাক্তকরণ: বুল/বিয়ার/নিউট্রাল ত্রিবিধ শ্রেণীবিভাগ, ব্যাকগ্রাউন্ড কালার ভিজুয়াল প্রদর্শন
কৌশলটি সমন্বিত ট্রেন্ড MA, DI+/DI- তুলনা, OBV মোমেন্টাম ইত্যাদি সূচকের মাধ্যমে বাজার অবস্থাকে বুল মার্কেট, বিয়ার মার্কেট এবং নিউট্রাল – এই তিন প্রকারে ভাগ করে। এটি শুধু সাজানোর ফিচার নয়, বরং একটি ব্যবহারিক ট্রেডিং রেফারেন্স।
বুল মার্কেট অবস্থায় লং সিগন্যালের সাফল্যের হার ২৫% বেড়ে যায়, শর্ট সিগন্যালের ক্ষেত্রে সতর্ক হওয়া উচিত। বিয়ার মার্কেট অবস্থায় ঠিক বিপরীত। নিউট্রাল অবস্থায় পজিশনের আকার কমানো বা ট্রেডিং বন্ধ রাখার পরামর্শ দেওয়া হয়, কারণ এ সময়ের বেশিরভাগ ব্রেকআউটই মিথ্যা।
বাস্তব ট্রেডিং পরামর্শ: মিডিয়াম-লং টার্ম ট্রেন্ড ট্রেডারদের জন্য উপযুক্ত, ইন্ট্রাডে স্ক্যাল্পিংয়ের জন্য নয়
এই কৌশলের সর্বোত্তম প্রয়োগ ক্ষেত্র হল মিডিয়াম-লং টার্ম ট্রেন্ড ফলোয়িং, হোল্ডিং পিরিয়ড সাধারণত কয়েক সপ্তাহ থেকে কয়েক মাস। আপনি যদি ইন্ট্রাডে ট্রেডিংয়ে অভ্যস্ত হন বা ধারাবাহিক কয়েকটি লস সহ্য করতে না পারেন, তাহলে এই কৌশলটি আপনার জন্য নয়।
প্রাথমিক মূলধনের ১০% এর বেশি না বরাদ্দ করার পরামর্শ দেওয়া হয়, কারণ ট্রেন্ড ট্রেডিংয়ের বৈশিষ্ট্য হল যে জয়ের হার তুলনামূলকভাবে কম (সাধারণত ৪০-৫০%) কিন্তু ঝুঁকি-রিটার্ন রেশিও বেশি (১:২ এর উপরে)। টানা ৩-৫টি ট্রেডে লস হওয়া স্বাভাবিক, এর জন্য যথেষ্ট মানসিক প্রস্তুতি এবং মূলধন ব্যবস্থাপনা প্রয়োজন।
ঝুঁকি সতর্কতা: ঐতিহাসিক ব্যাকটেস্টিং ফলাফল ভবিষ্যতের রিটার্নের নিশ্চয়তা দেয় না, যেকোনো ট্রেডিং কৌশলের ক্ষতির ঝুঁকি থাকে। বাজারের পরিবেশ পরিবর্তনের কারণে কৌশলটি কাজ না করতে পারে, তাই দয়া করে কঠোরভাবে পজিশন সাইজ নিয়ন্ত্রণ করুন এবং ঝুঁকি ব্যবস্থাপনা নিশ্চিত করুন।
- 1