
„Magische Double-EMA-Gleitende-Durchschnitts-Strategie“ vom YouTube-Meister
In dieser Ausgabe besprechen wir eine „magische Doppel-EMA-Gleitende-Durchschnitts-Strategie“ von YouTube, die als „Aktien- und Kryptowährungsmarktkiller“ bezeichnet wird. Nachdem ich das Video gesehen hatte, erfuhr ich, dass es sich bei dieser Strategie um eine Trading-View-Strategie in der Pine-Sprache handelt, die zwei Trading-View-Indikatoren verwendet. Als ich sah, dass die Backtesting-Ergebnisse im Video sehr gut waren und FMZ auch die Pine-Sprache von Trading View unterstützt, wollte ich einfach selbst einen Backtest durchführen und die Analyse testen. Dann starte das ganze Leben! Lassen Sie uns die Strategie im Video nachbilden.
Von der Strategie verwendete Indikatoren
- EMA-Indikator
Der Einfachheit halber verwenden wir nicht die im Video aufgeführte gleitende Mittelwert-Exponentialfunktion. Wir verwenden stattdessen das integrierte ta.ema in der Handelsansicht (eigentlich sind sie dasselbe).
- VuManChu Swing Free Indikator
Dies ist ein Indikator in Trading View. Wir müssen zu Trading View gehen und den Quellcode herunterladen.
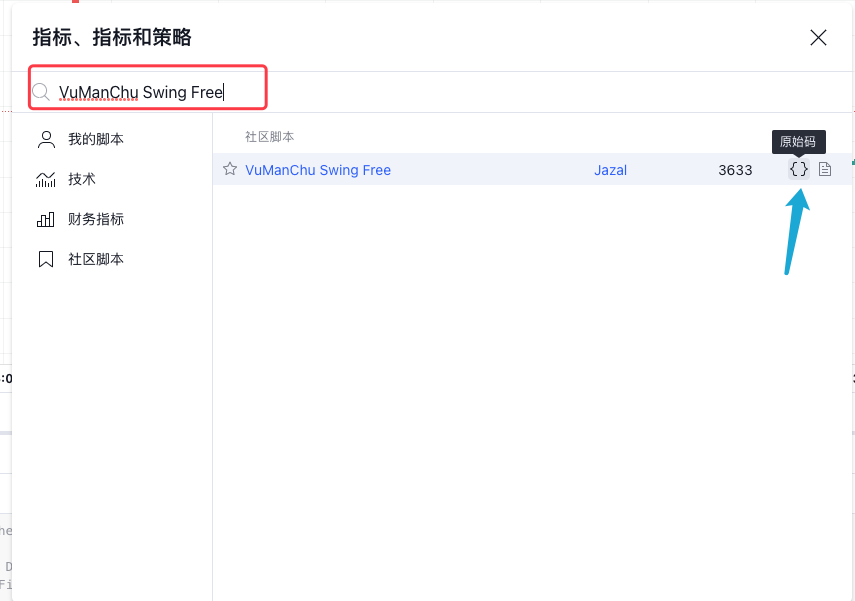
Kostenloser Code für VuManChu Swing:
pine
// This source code is subject to the terms of the Mozilla Public License 2.0 at https://mozilla.org/MPL/2.0/
// Credits to the original Script - Range Filter DonovanWall https://www.tradingview.com/script/lut7sBgG-Range-Filter-DW/
// This version is the old version of the Range Filter with less settings to tinker with
//@version=4
study(title="Range Filter - B&S Signals", shorttitle="RF - B&S Signals", overlay=true)
//-----------------------------------------------------------------------------------------------------------------------------------------------------------------
//Functions
//-----------------------------------------------------------------------------------------------------------------------------------------------------------------
//Range Size Function
rng_size(x, qty, n)=>
// AC = Cond_EMA(abs(x - x[1]), 1, n)
wper = (n*2) - 1
avrng = ema(abs(x - x[1]), n)
AC = ema(avrng, wper)*qty
rng_size = AC
//Range Filter Function
rng_filt(x, rng_, n)=>
r = rng_
var rfilt = array.new_float(2, x)
array.set(rfilt, 1, array.get(rfilt, 0))
if x - r > array.get(rfilt, 1)
array.set(rfilt, 0, x - r)
if x + r < array.get(rfilt, 1)
array.set(rfilt, 0, x + r)
rng_filt1 = array.get(rfilt, 0)
hi_band = rng_filt1 + r
lo_band = rng_filt1 - r
rng_filt = rng_filt1
[hi_band, lo_band, rng_filt]
//-----------------------------------------------------------------------------------------------------------------------------------------------------------------
//Inputs
//-----------------------------------------------------------------------------------------------------------------------------------------------------------------
//Range Source
rng_src = input(defval=close, type=input.source, title="Swing Source")
//Range Period
rng_per = input(defval=20, minval=1, title="Swing Period")
//Range Size Inputs
rng_qty = input(defval=3.5, minval=0.0000001, title="Swing Multiplier")
//Bar Colors
use_barcolor = input(defval=false, type=input.bool, title="Bar Colors On/Off")
//-----------------------------------------------------------------------------------------------------------------------------------------------------------------
//Definitions
//-----------------------------------------------------------------------------------------------------------------------------------------------------------------
//Range Filter Values
[h_band, l_band, filt] = rng_filt(rng_src, rng_size(rng_src, rng_qty, rng_per), rng_per)
//Direction Conditions
var fdir = 0.0
fdir := filt > filt[1] ? 1 : filt < filt[1] ? -1 : fdir
upward = fdir==1 ? 1 : 0
downward = fdir==-1 ? 1 : 0
//Trading Condition
longCond = rng_src > filt and rng_src > rng_src[1] and upward > 0 or rng_src > filt and rng_src < rng_src[1] and upward > 0
shortCond = rng_src < filt and rng_src < rng_src[1] and downward > 0 or rng_src < filt and rng_src > rng_src[1] and downward > 0
CondIni = 0
CondIni := longCond ? 1 : shortCond ? -1 : CondIni[1]
longCondition = longCond and CondIni[1] == -1
shortCondition = shortCond and CondIni[1] == 1
//Colors
filt_color = upward ? #05ff9b : downward ? #ff0583 : #cccccc
bar_color = upward and (rng_src > filt) ? (rng_src > rng_src[1] ? #05ff9b : #00b36b) :
downward and (rng_src < filt) ? (rng_src < rng_src[1] ? #ff0583 : #b8005d) : #cccccc
//-----------------------------------------------------------------------------------------------------------------------------------------------------------------
//Outputs
//-----------------------------------------------------------------------------------------------------------------------------------------------------------------
//Filter Plot
filt_plot = plot(filt, color=filt_color, transp=67, linewidth=3, title="Filter")
//Band Plots
h_band_plot = plot(h_band, color=color.new(#05ff9b, 100), title="High Band")
l_band_plot = plot(l_band, color=color.new(#ff0583, 100), title="Low Band")
//Band Fills
fill(h_band_plot, filt_plot, color=color.new(#00b36b, 92), title="High Band Fill")
fill(l_band_plot, filt_plot, color=color.new(#b8005d, 92), title="Low Band Fill")
//Bar Color
barcolor(use_barcolor ? bar_color : na)
//Plot Buy and Sell Labels
plotshape(longCondition, title = "Buy Signal", text ="BUY", textcolor = color.white, style=shape.labelup, size = size.normal, location=location.belowbar, color = color.new(color.green, 0))
plotshape(shortCondition, title = "Sell Signal", text ="SELL", textcolor = color.white, style=shape.labeldown, size = size.normal, location=location.abovebar, color = color.new(color.red, 0))
//Alerts
alertcondition(longCondition, title="Buy Alert", message = "BUY")
alertcondition(shortCondition, title="Sell Alert", message = "SELL")
Strategielogik
EMA-Indikator: Die Strategie verwendet zwei gleitende EMA-Durchschnitte, eine schnelle Linie (kleiner Zyklusparameter) und eine langsame Linie (großer Zyklusparameter). Die Hauptfunktion des gleitenden Durchschnitts mit doppeltem EMA besteht darin, uns bei der Bestimmung der Richtung von Markttrends zu helfen.
-
Lange Anordnung
Die schnelle Linie liegt über der langsamen Linie. -
Kurzvereinbarung
Die schnelle Linie liegt unterhalb der langsamen Linie.
VuManChu Swing Free-Indikator: Der VuManChu Swing Free-Indikator wird zum Senden von Signalen verwendet und dann in Kombination mit anderen Bedingungen bestimmt, ob eine Handelsorder aufgegeben werden soll. Aus dem Quellcode des VuManChu Swing Free-Indikators können wir erkennen, dass die Variable „longCondition“ das Kaufsignal und die Variable „shortCondition“ das Verkaufssignal darstellt. Diese beiden Variablen werden später beim Schreiben der Bestellbedingungen verwendet.
Lassen Sie uns nun über die spezifischen Bedingungen für die Auslösung von Handelssignalen in der Strategie sprechen:
-
Regeln für das Eingehen von Long-Positionen:
Der Schlusskurs der positiven K-Linie sollte über der schnellen EMA-Linie liegen, die beiden gleitenden Durchschnitte der EMA sollten in einer bullischen Anordnung sein (die schnelle Linie liegt über der langsamen Linie) und der VuManChu Swing Free-Indikator sollte ein Kaufsignal anzeigen (LongCondition ist wahr). Wenn die drei Bedingungen erfüllt sind, ist diese K-Linie die Schlüssel-K-Linie für den Einstieg in eine Long-Position, und der Schlusskurs dieser K-Linie ist die Einstiegsposition. -
Regeln für das Eingehen einer Short-Position (im Gegensatz zu einer Long-Position):
Der Schlusskurs der negativen Kerze sollte unter der schnellen EMA-Linie liegen, die beiden gleitenden Durchschnitte der EMA sollten sich in einer Short-Position befinden (die schnelle Linie liegt unter der langsamen Linie) und der VuManChu Swing Free-Indikator sollte ein Verkaufssignal anzeigen (ShortCondition ist wahr). Wenn die drei Bedingungen erfüllt sind, ist der Schlusskurs dieser K-Linie der Einstiegspunkt für Leerverkäufe.
Ist die Handelslogik nicht sehr einfach? Da das Quellvideo Take-Profit und Stop-Loss nicht angibt, wird der Editor eine moderatere Take-Profit- und Stop-Loss-Methode verwenden, indem er einen Fixpunkt-Stop-Loss und ein Tracking verwendet Gewinnmitnahme.
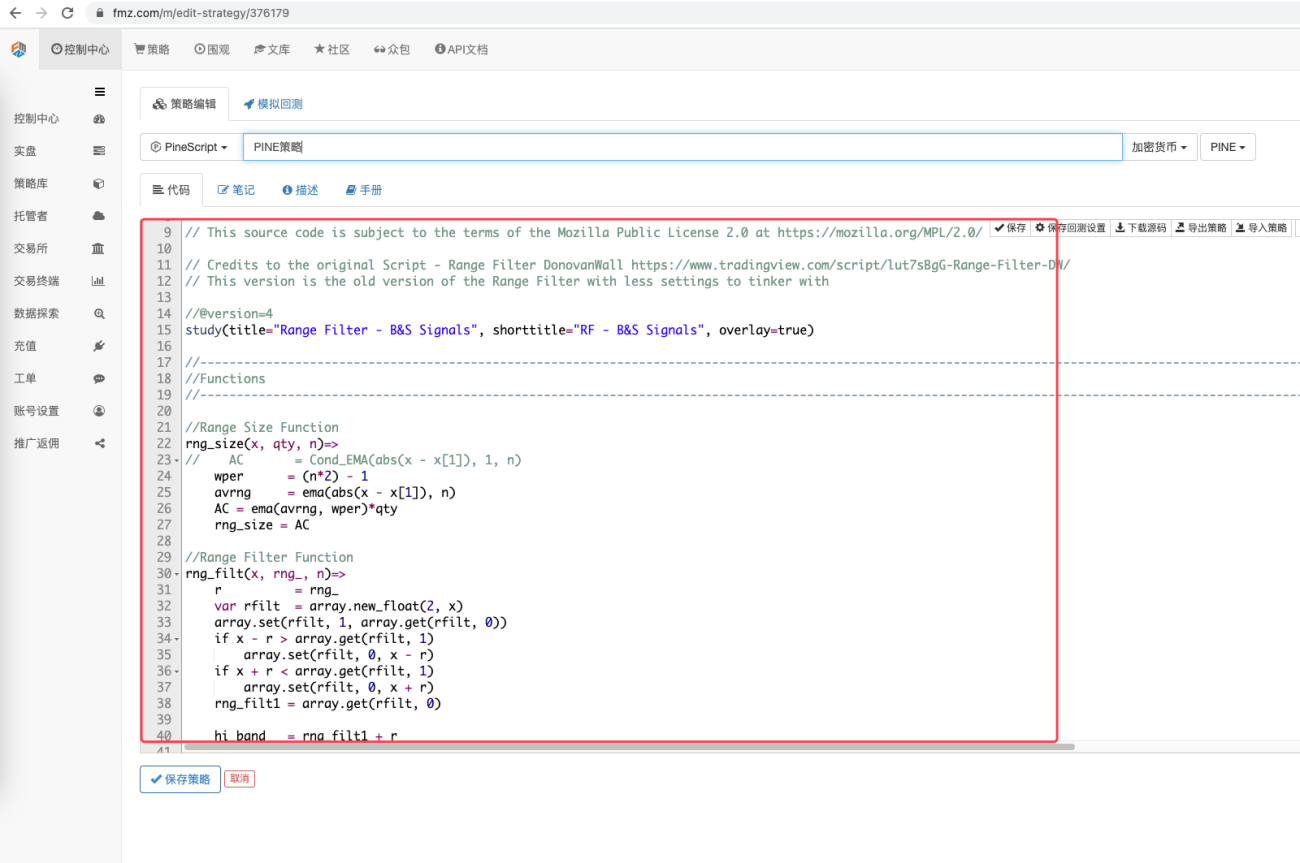
Code-Entwurf
Wir haben den Code des VuManChu Swing Free-Indikators direkt und unverändert in unseren Strategiecode eingefügt.
Dann schreiben wir einen Code in der Pine-Sprache, um die Transaktionsfunktion zu implementieren:
pine
// extend
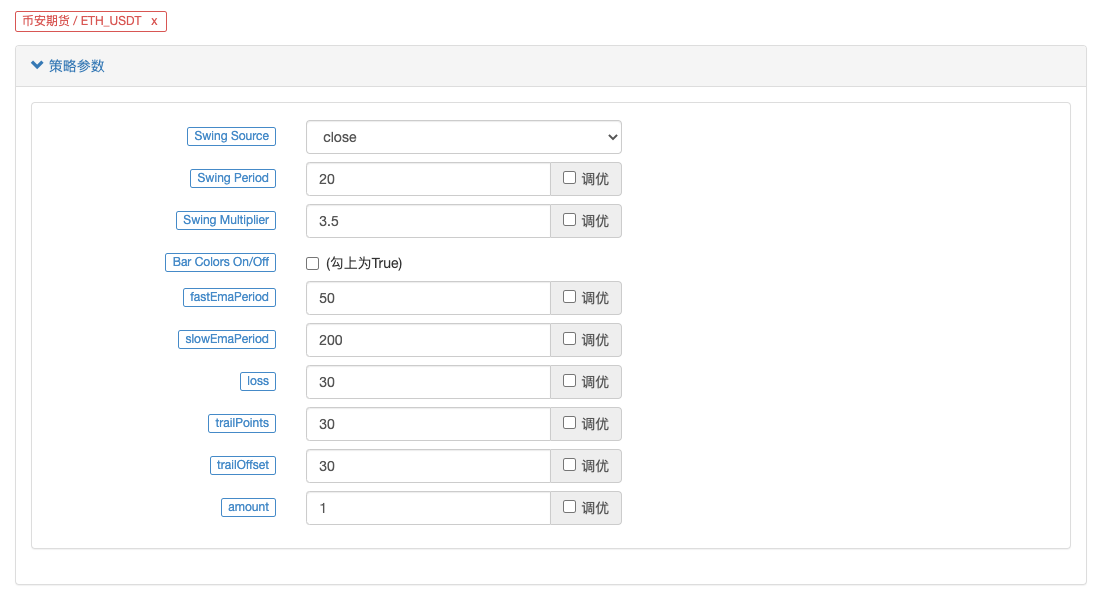
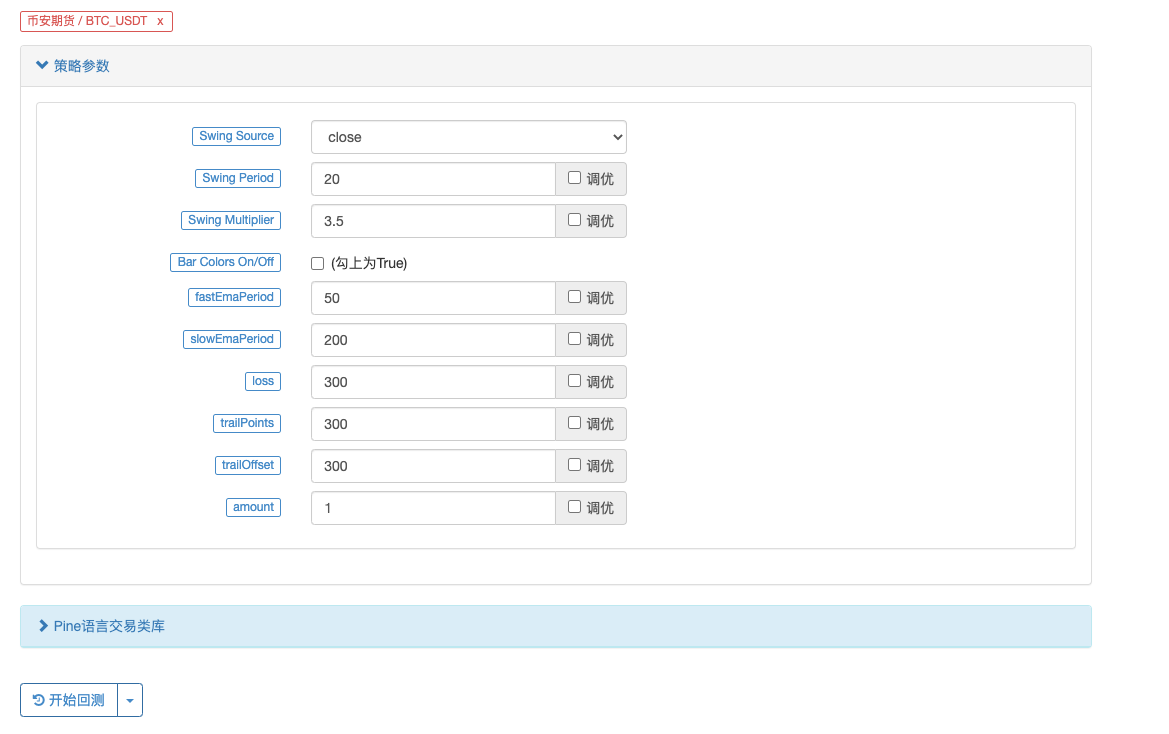
fastEmaPeriod = input(50, "fastEmaPeriod") // 快线周期
slowEmaPeriod = input(200, "slowEmaPeriod") // 慢线周期
loss = input(30, "loss") // 止损点数
trailPoints = input(30, "trailPoints") // 移动止盈触发点数
trailOffset = input(30, "trailOffset") // 移动止盈偏移量(点数)
amount = input(1, "amount") // 下单量
emaFast = ta.ema(close, fastEmaPeriod) // 计算快线EMA
emaSlow = ta.ema(close, slowEmaPeriod) // 计算慢线EMA
buyCondition = longCondition and emaFast > emaSlow and close > open and close > emaFast // 做多入场条件
sellCondition = shortCondition and emaFast < emaSlow and close < open and close < emaFast // 做空入场条件
if buyCondition and strategy.position_size == 0
strategy.entry("long", strategy.long, amount)
strategy.exit("exit_long", "long", amount, loss=loss, trail_points=trailPoints, trail_offset=trailOffset)
if sellCondition and strategy.position_size == 0
strategy.entry("short", strategy.short, amount)
strategy.exit("exit_short", "short", amount, loss=loss, trail_points=trailPoints, trail_offset=trailOffset)
A. Wie Sie sehen, gilt Folgendes, wenn buyCondition wahr ist:
- Die Variable „longCondition“ ist wahr (der Indikator „VuManChu Swing Free“ sendet ein Signal zum Long-Einstieg).
- emaFast > emaSlow (EMA-bullische Anordnung).
- Schluss > Eröffnung (zeigt an, dass der aktuelle BAR eine positive Linie ist), Schluss > emaFast (zeigt an, dass der Schlusskurs über der EMA-Fast-Linie liegt).
Die drei Bedingungen für eine Long-Position sind erfüllt.
B. Wenn sellCondition erfüllt ist, sind die drei Bedingungen für Leerverkäufe erfüllt (hier nicht erklärt).
Wenn die If-Bedingung dann feststellt, dass das Signal ausgelöst wurde, verwenden Sie die Funktion strategy.entry, um in den Markt einzusteigen und eine Position zu eröffnen, und stellen Sie die Funktion strategy.exit auf Stop-Loss und Trailing-Profit ein.
Vollständiger Code
            pine

            /*backtest
start: 2022-01-01 00:00:00
end: 2022-10-08 00:00:00
period: 15m
basePeriod: 5m
exchanges: [{"eid":"Futures_Binance","currency":"ETH_USDT"}]
args: [["ZPrecision",0,358374]]
*/

// This source code is subject to the terms of the Mozilla Public License 2.0 at https://mozilla.org/MPL/2.0/

// Credits to the original Script - Range Filter DonovanWall https://www.tradingview.com/script/lut7sBgG-Range-Filter-DW/
// This version is the old version of the Range Filter with less settings to tinker with

//@version=4
study(title="Range Filter - B&S Signals", shorttitle="RF - B&S Signals", overlay=true)

//-----------------------------------------------------------------------------------------------------------------------------------------------------------------
//Functions
//-----------------------------------------------------------------------------------------------------------------------------------------------------------------

//Range Size Function
rng_size(x, qty, n)=>
//    AC       = Cond_EMA(abs(x - x[1]), 1, n)
    wper      = (n*2) - 1
    avrng     = ema(abs(x - x[1]), n)
    AC = ema(avrng, wper)*qty
    rng_size = AC

//Range Filter Function
rng_filt(x, rng_, n)=>
    r          = rng_
    var rfilt  = array.new_float(2, x)
    array.set(rfilt, 1, array.get(rfilt, 0))
    if x - r > array.get(rfilt, 1)
        array.set(rfilt, 0, x - r)
    if x + r < array.get(rfilt, 1)
        array.set(rfilt, 0, x + r)
    rng_filt1 = array.get(rfilt, 0)

    hi_band   = rng_filt1 + r
    lo_band   = rng_filt1 - r
    rng_filt  = rng_filt1
    [hi_band, lo_band, rng_filt]

//-----------------------------------------------------------------------------------------------------------------------------------------------------------------
//Inputs
//-----------------------------------------------------------------------------------------------------------------------------------------------------------------

//Range Source
rng_src = input(defval=close, type=input.source, title="Swing Source")

//Range Period
rng_per = input(defval=20, minval=1, title="Swing Period")

//Range Size Inputs
rng_qty   = input(defval=3.5, minval=0.0000001, title="Swing Multiplier")

//Bar Colors
use_barcolor = input(defval=false, type=input.bool, title="Bar Colors On/Off")

//-----------------------------------------------------------------------------------------------------------------------------------------------------------------
//Definitions
//-----------------------------------------------------------------------------------------------------------------------------------------------------------------

//Range Filter Values
[h_band, l_band, filt] = rng_filt(rng_src, rng_size(rng_src, rng_qty, rng_per), rng_per)

//Direction Conditions
var fdir = 0.0
fdir    := filt > filt[1] ? 1 : filt < filt[1] ? -1 : fdir
upward   = fdir==1 ? 1 : 0
downward = fdir==-1 ? 1 : 0

//Trading Condition
longCond = rng_src > filt and rng_src > rng_src[1] and upward > 0 or rng_src > filt and rng_src < rng_src[1] and upward > 0
shortCond = rng_src < filt and rng_src < rng_src[1] and downward > 0 or rng_src < filt and rng_src > rng_src[1] and downward > 0

CondIni = 0
CondIni := longCond ? 1 : shortCond ? -1 : CondIni[1]
longCondition = longCond and CondIni[1] == -1
shortCondition = shortCond and CondIni[1] == 1

//Colors
filt_color = upward ? #05ff9b : downward ? #ff0583 : #cccccc
bar_color  = upward and (rng_src > filt) ? (rng_src > rng_src[1] ? #05ff9b : #00b36b) :
             downward and (rng_src < filt) ? (rng_src < rng_src[1] ? #ff0583 : #b8005d) : #cccccc

//-----------------------------------------------------------------------------------------------------------------------------------------------------------------
//Outputs
//-----------------------------------------------------------------------------------------------------------------------------------------------------------------

//Filter Plot
filt_plot = plot(filt, color=filt_color, transp=67, linewidth=3, title="Filter")

//Band Plots
h_band_plot = plot(h_band, color=color.new(#05ff9b, 100), title="High Band")
l_band_plot = plot(l_band, color=color.new(#ff0583, 100), title="Low Band")

//Band Fills
fill(h_band_plot, filt_plot, color=color.new(#00b36b, 92), title="High Band Fill")
fill(l_band_plot, filt_plot, color=color.new(#b8005d, 92), title="Low Band Fill")

//Bar Color
barcolor(use_barcolor ? bar_color : na)

//Plot Buy and Sell Labels
plotshape(longCondition, title = "Buy Signal", text ="BUY", textcolor = color.white, style=shape.labelup, size = size.normal, location=location.belowbar, color = color.new(color.green, 0))
plotshape(shortCondition, title = "Sell Signal", text ="SELL", textcolor = color.white, style=shape.labeldown, size = size.normal, location=location.abovebar, color = color.new(color.red, 0))

//Alerts
alertcondition(longCondition, title="Buy Alert", message = "BUY")
alertcondition(shortCondition, title="Sell Alert", message = "SELL")


// extend
fastEmaPeriod = input(50, "fastEmaPeriod")
slowEmaPeriod = input(200, "slowEmaPeriod")
loss = input(30, "loss")
trailPoints = input(30, "trailPoints")
trailOffset = input(30, "trailOffset")
amount = input(1, "amount")

emaFast = ta.ema(close, fastEmaPeriod)
emaSlow = ta.ema(close, slowEmaPeriod)

buyCondition = longCondition and emaFast > emaSlow and close > open and close > emaFast
sellCondition = shortCondition and emaFast < emaSlow and close < open and close < emaFast

if buyCondition and strategy.position_size == 0
    strategy.entry("long", strategy.long, amount)
    strategy.exit("exit_long", "long", amount, loss=loss, trail_points=trailPoints, trail_offset=trailOffset)
if sellCondition and strategy.position_size == 0
    strategy.entry("short", strategy.short, amount)
    strategy.exit("exit_short", "short", amount, loss=loss, trail_points=trailPoints, trail_offset=trailOffset)
Backtesting
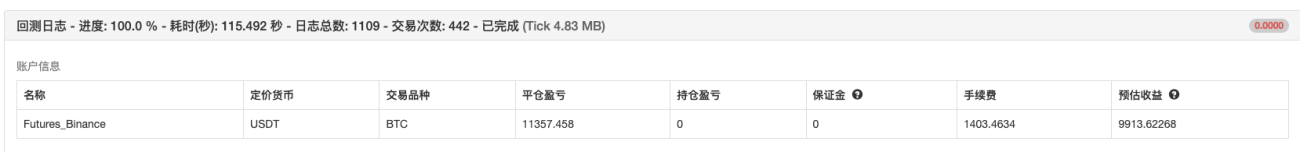
Der Backtesting-Zeitraum wird von Januar 2022 bis Oktober 2022 gewählt, die K-Line-Periode beträgt 15 Minuten und das Schlusskursmodell wird für das Backtesting verwendet. Der Markt wählt den unbefristeten ETH_USDT-Vertrag von Binance. Die Parametereinstellungen sind wie im Quellvideo angegeben: 50 Perioden für die schnelle Linie und 200 Perioden für die langsame Linie; andere Parameter bleiben standardmäßig unverändert. Beim Festlegen der Stop-Loss- und Trailing-Profit-Punkte bin ich etwas subjektiv und setze sie einfach auf 30 Punkte.
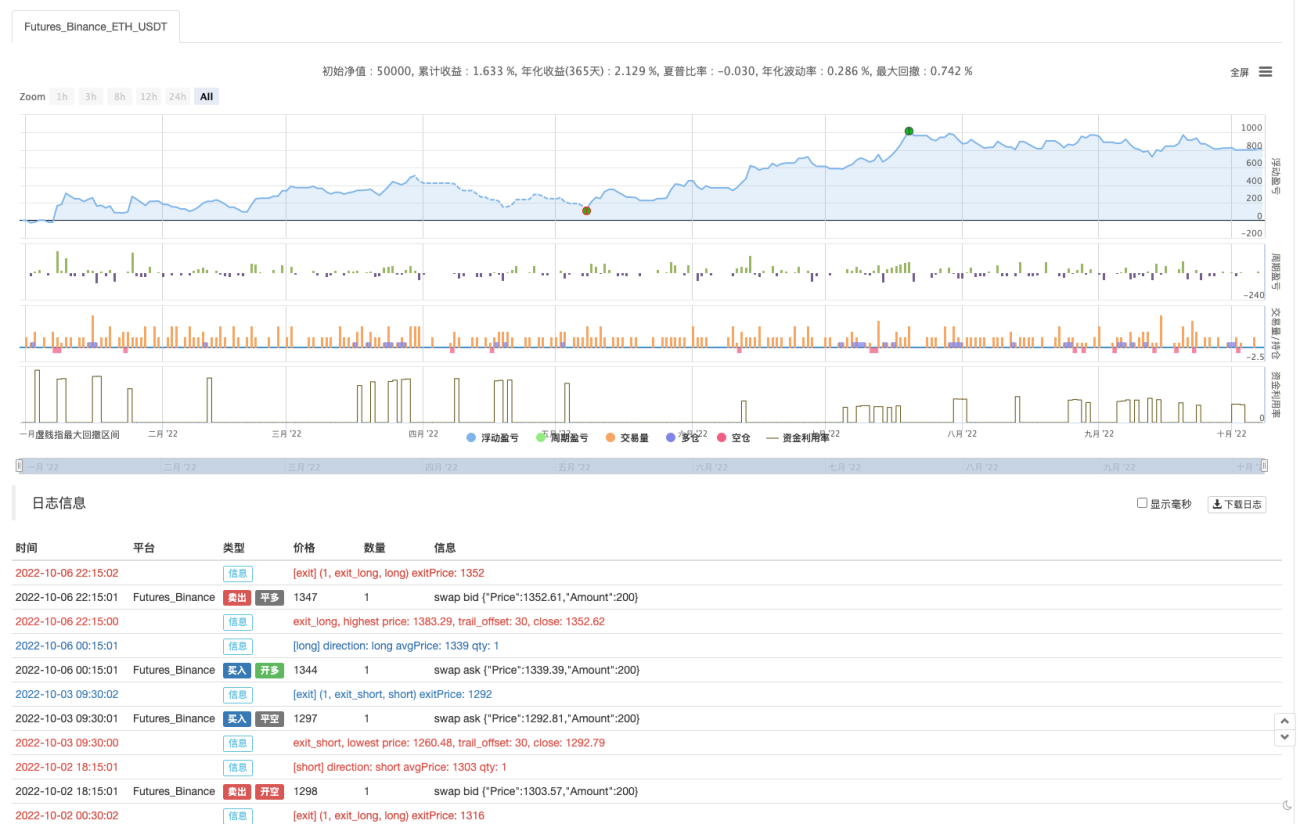
Die Backtest-Ergebnisse sind mittelmäßig. Nach mehreren Backtests scheinen Parameter wie Take-Profit und Stop-Loss einen gewissen Einfluss auf die Backtest-Ergebnisse zu haben. Ich bin der Meinung, dass dieser Aspekt noch weiter optimiert werden muss. Die Gewinnquote ist jedoch immer noch gut, nachdem das Strategiesignal die Transaktion ausgelöst hat.
Versuchen wir es mit einem unbefristeten BTC_USDT-Vertrag:
Auch die Ergebnisse des Backtests zu BTC sind brisant:
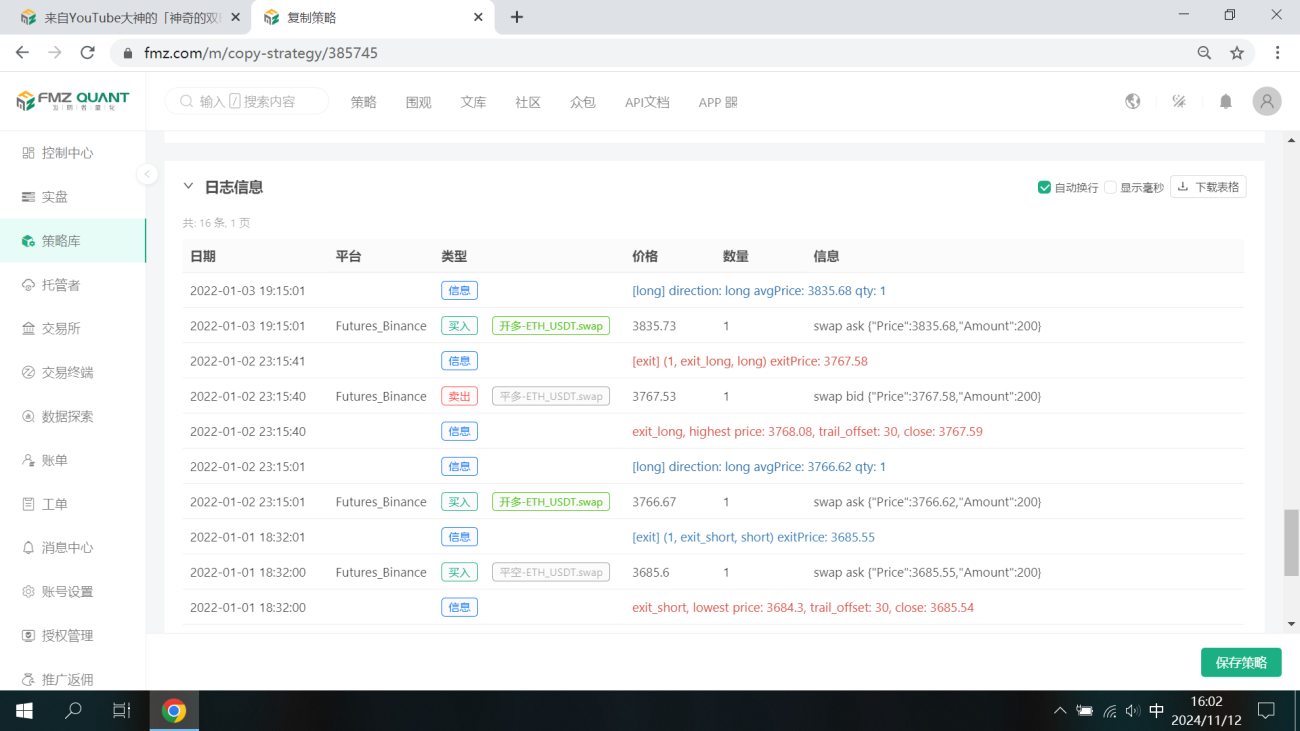
Strategieadresse: https://www.fmz.com/strategy/385745
Es scheint, dass diese Handelsmethode relativ zuverlässig ist, um den Trend zu erfassen, und das Design kann basierend auf dieser Idee weiter optimiert werden. In diesem Artikel haben wir nicht nur die Idee einer Strategie mit doppeltem gleitendem Durchschnitt kennengelernt, sondern auch gelernt, wie man die Strategien der Meister auf YouTube verarbeitet und lernt. OK, die oben genannten Strategiecodes sind nur meine Vorschläge. Die Backtest-Ergebnisse stellen nicht die spezifischen tatsächlichen Ergebnisse dar. Die Strategiecodes und Designs dienen nur als Referenz. Vielen Dank für Ihre Unterstützung, bis zum nächsten Mal!


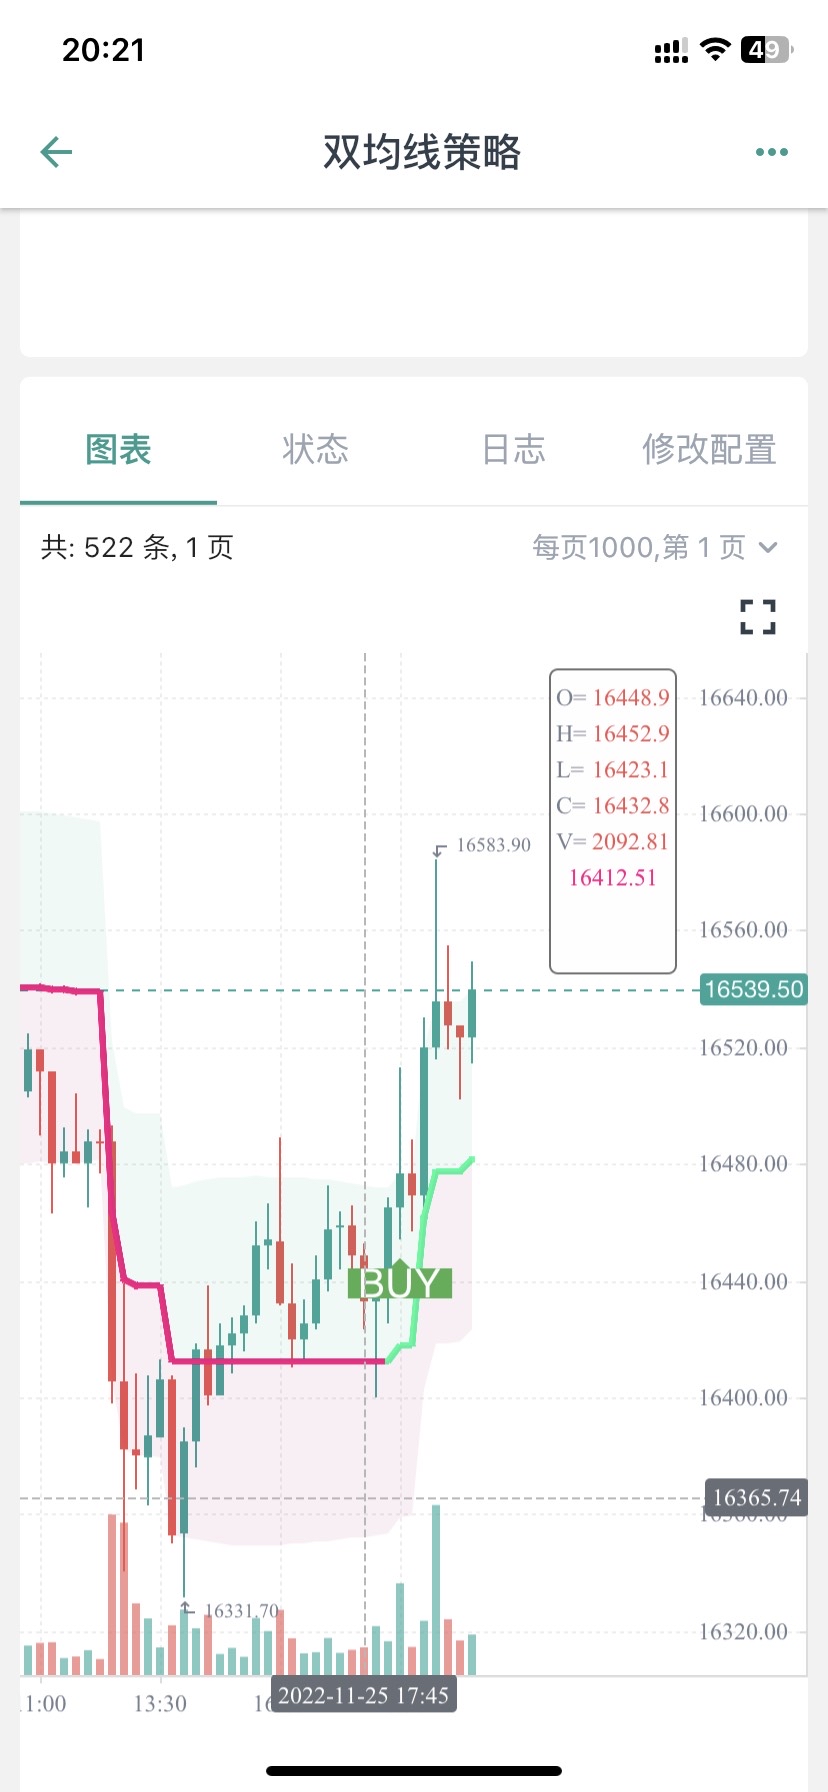


您好,这个是因为图表上显示的BUY标记只是文章中指标的信号显示,后面还结合了均线。
            //Plot Buy and Sell Labels
plotshape(longCondition, title = "Buy Signal", text ="BUY", textcolor = color.white, style=shape.labelup, size = size.normal, location=location.belowbar, color = color.new(color.green, 0))
plotshape(shortCondition, title = "Sell Signal", text ="SELL", textcolor = color.white, style=shape.labeldown, size = size.normal, location=location.abovebar, color = color.new(color.red, 0))
plotshape(longCondition, title = "Buy Signal", text ="BUY 画图显示时,只是longCondition条件符合了。
下单条件在这一块:
            if buyCondition and strategy.position_size == 0
    strategy.entry("long", strategy.long, amount)
    strategy.exit("exit_long", "long", amount, loss=loss, trail_points=trailPoints, trail_offset=trailOffset)
if sellCondition and strategy.position_size == 0
    strategy.entry("short", strategy.short, amount)
    strategy.exit("exit_short", "short", amount, loss=loss, trail_points=trailPoints, trail_offset=trailOffset)

梦大,建议从油管找两三个具有代表性的,改写难度较大,函数、参数、运算方式较多的策略做几个文字版的教程,比如带有类似【line.delete】这样的。(不需要策略盈利,就算是亏损的策略也无所谓,主要是用来学习写策略)。
我现在用这个双均线的策略,已经学会改一些不是非常复杂的组合策略了,改了十几个组合策略,其中有一两个确实是21年22年数据回测结果非常不错的,也已经在跑实盘测试了,但是遇到复杂函数参数运算这种【比如提示:line: 62 Could not find function or function reference 'line.delete',】而在FMZ PINE Script 文档并没有找到line.delete相关解释,用法说明,就懵圈了,所以希望梦大能弄点儿复杂策略改写一下,当然注释也多一些最好。就更方便学习了。[抱拳]
谢谢梦大。


梦大,请教下,PINE可以写复杂点儿的止盈方式吗?比如分层级止盈这样的???谢谢。
如果PINE可以和JS混编就好了,比如用PINE写指标,JS写交易部分就方便多了。。。。。
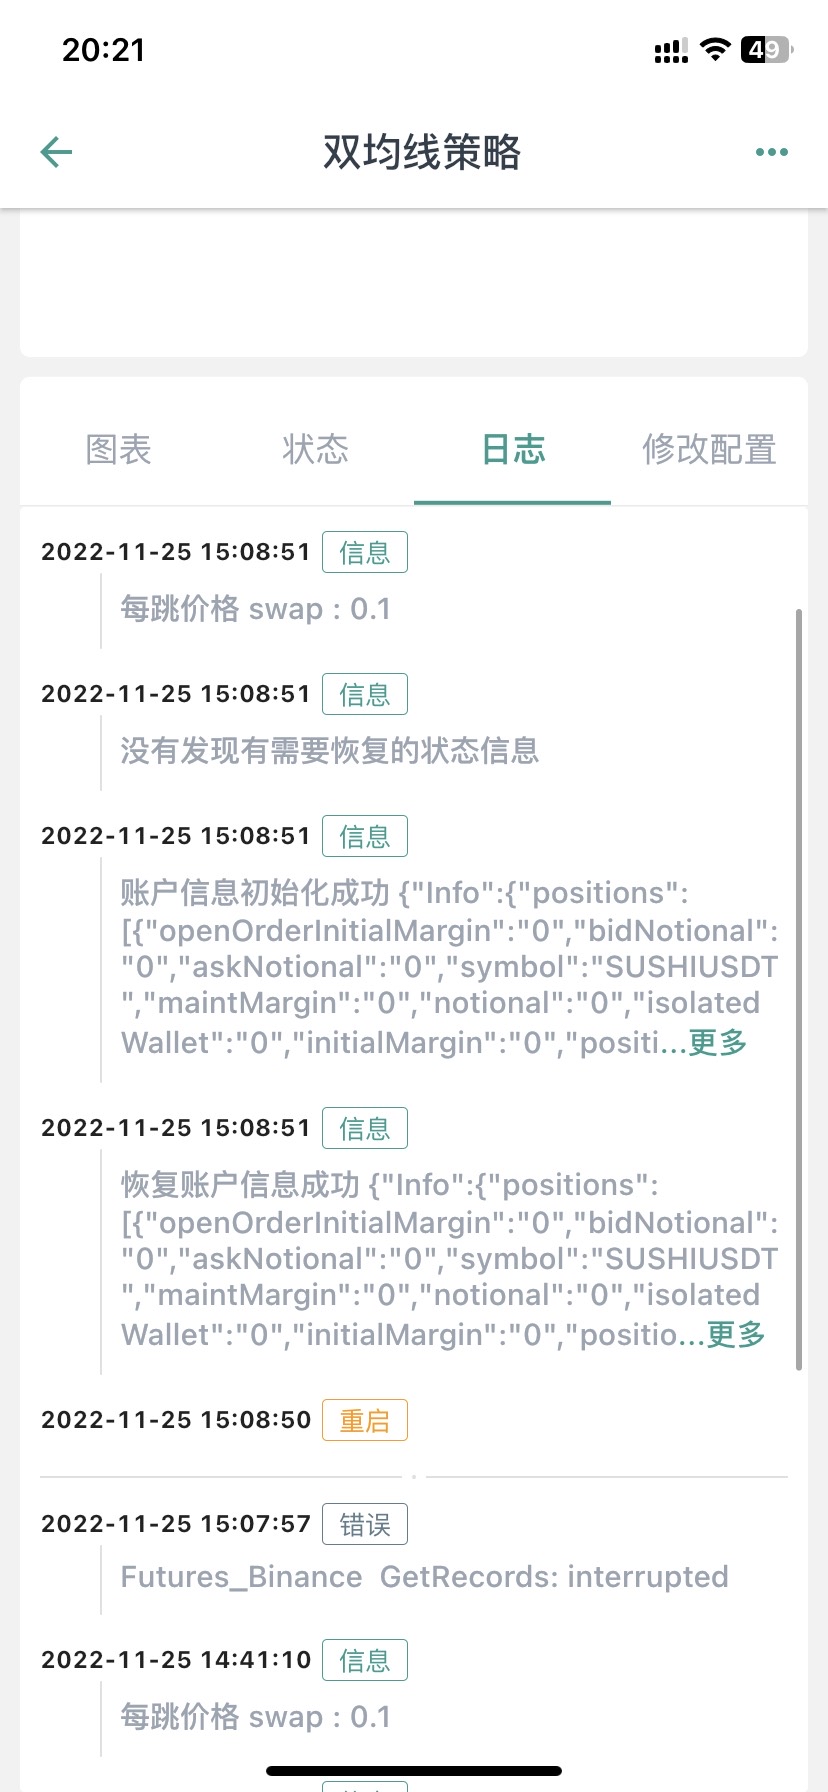
好的,谢谢梦大,另外请教下,PINE回测时间区间有限制吗?我选择2021年1月1日,到2022年10月11日,提示错误:
RuntimeError: abort(undefined) at Error at jsStackTrace (eval at self.onmessage (https://www.fmz.com/scripts/worker_detours.393054f7.js:1:147), <anonymous>:1:2096171) at stackTrace (eval at self.onmessage (https://www.fmz.com/scripts/worker_detours.393054f7.js:1:147), <anonymous>:1:2096345) at abort (eval at self.onmessage (https://www.fmz.com/scripts/worker_detours.393054f7.js:1:147), <anonymous>:1:2092408) at _abort (eval at self.onmessage (https://www.fmz.com/scripts/worker_detours.393054f7.js:1:147), <anonymous>:1:2137287) at <anonymous>:wasm-function[1297]:0x76bdc at <anonymous>:wasm-function[466]:0x3d789 at <anonymous>:wasm-function[477]:0x42e6b at <anonymous>:wasm-function[471]:0x4149e at <anonymous>:wasm-function[453]:0x3bf18 at <anonymous>:wasm-function[173]:0x13122
但是如果不改时间段就正常回测了。。。。 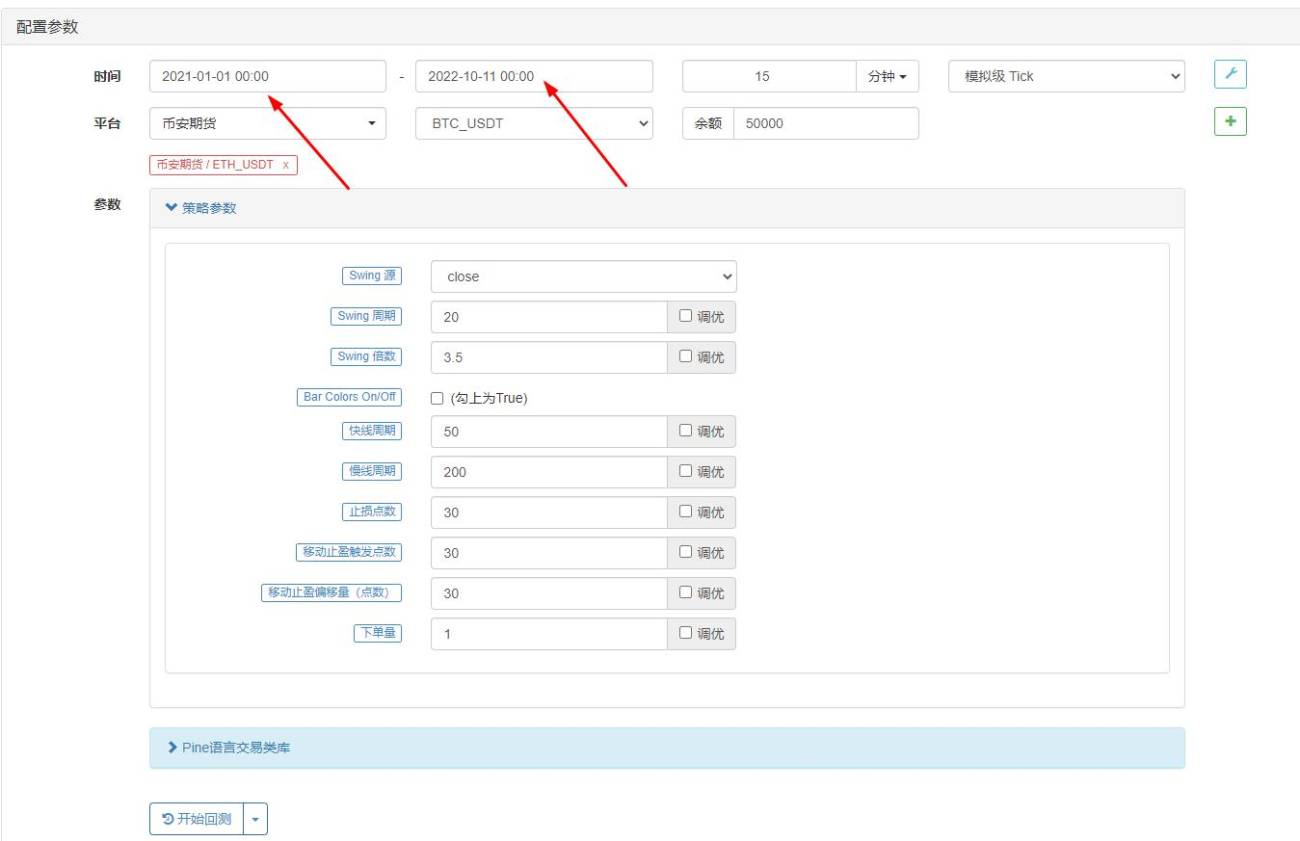

- 1