Handelsstrategie mit traditionellen gleitenden Durchschnittsindikatoren und dem KD-Indikator

0
Follow
18
Followers
- Strategiename: Handelstrategie mit traditionellem gleitendem Mittelwert und KD-Indikator
- Datenzyklus: 15M, 30M usw.
- Unterstützt: Rohstoff-Futures, Kryptowährungen
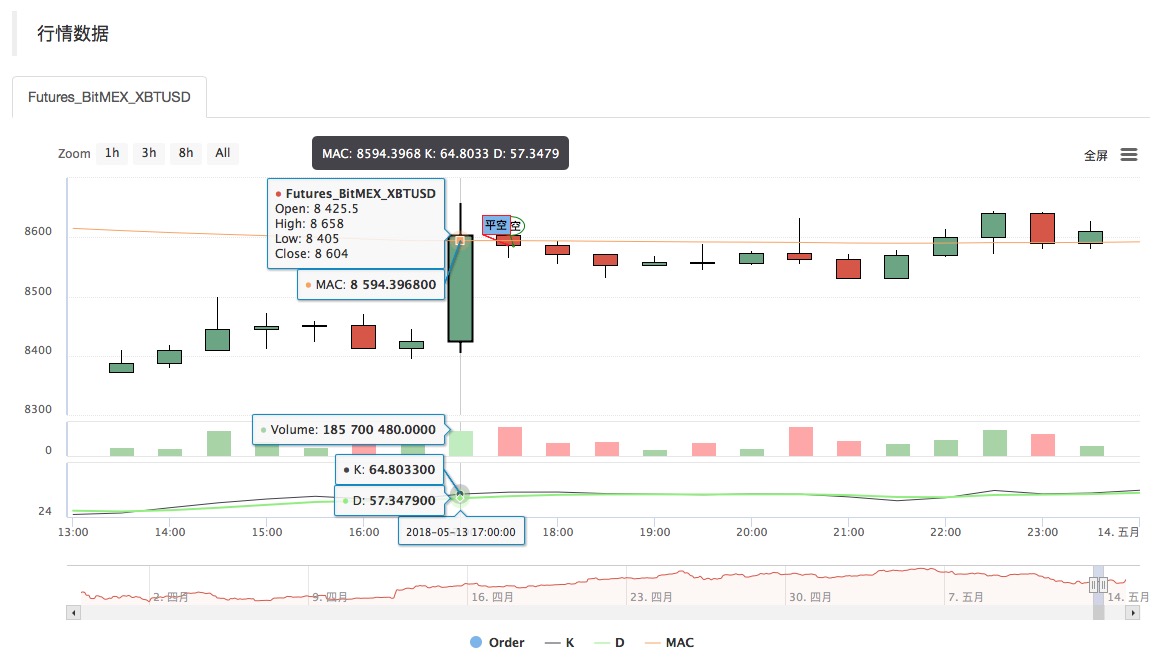
- Indikatoren: Verwendung von EMA und KD-Linie, wobei die KD-Linie mit Standardparametern (Indikatorparameter fest 3, 3, 9) verwendet wird
- Offizielle Website: www.quantinfo.com
-
Hauptchart
EMA-Gleitender Mittelwert, Formel: MAC^^EMA(C,N); -
Nebenchart
K-Linie der KD-Linie, Formel: K:SMA(RSV,M1,1);//Gleitender Mittelwert von RSV
D-Linie der KD-Linie, Formel: D:SMA(K,M2,1);//Gleitender Mittelwert von K
Source
MyLang
Strategy parameters
Related strategies
Comment
All comments (0)
No data
- 1