Trailing Breakout-Strategie


Erstellungsdatum: 2023-10-17 16:36:49 zuletzt geändert: 2023-10-17 16:36:49
Kopie: 0 Klicks: 690
1
konzentrieren Sie sich auf
1617
Anhänger

Trailing Breakout-Strategie

Überblick

Diese Strategie kombiniert Trend- und Breakout-Handelsideen. Auf der Grundlage der Beurteilung des langen Trendstrends werden Eintragungen für kürzeren Durchbruchspunkte gesucht, um einen flüssigen Handel in einem Trend zu erzielen. Darüber hinaus wird ein Stop-Loss- und Stop-Stop-Level festgelegt, um das Risiko-Gewinn-Verhältnis für jeden einzelnen Handel zu kontrollieren.

Strategieprinzip

  1. Einstellung der Parameter für die Zhongcheng-Kanal-Zink-Anzeige mit der Standard-Periode 20;

  2. Setzen Sie die EMA-Gleichbewegungsmittellinie auf die Standard-Periode 200;

  3. Das Risiko-Gewinn-Verhältnis wird als Standard 1.5 eingestellt.

  4. Setzen Sie die Durchbruch-Rückschritt-Parameter auf mehrere oder leere Köpfe.

  5. Ob ein Durchbruch ein Höchstwert oder ein Tiefpunkt war;

  6. Mehrköpfige Signal: Erzeugt mehrköpfige Signal, wenn der vorherige Durchbruch ist niedrig, und der Preis ist höher als die Tangjian Oberbahn und höher als die EMA-Mittellinie;

  7. Flachkopfsignal: Erzeugt ein Flachkopfsignal, wenn der vorherige Durchbruch ein Hoch ist und der Preis unterhalb der Donchian-Unterbahn und unterhalb der EMA-Mittellinie liegt;

  8. Nach dem Eintritt in die Multi-Head-Position wurde der Stop-Loss auf einen Rückzug von 5 Punkten nach der Tangjian-Bahn eingestellt, und der Stop-Loss wurde als das Risiko-Gewinn-Verhältnis multipliziert mit der Stop-Distance;

  9. Nach dem Eintritt in die leere Position wird der Stop-Loss auf 5 Punkte Rückzug auf die Tangjian-Strecke gesetzt. Der Stop-Loss ist das Risiko-Gewinn-Verhältnis multipliziert mit der Stop-Distance.

Auf diese Weise kann die Strategie, kombiniert mit Trendbeurteilung und Breakout-Operationen, die Chancen für kürzere Perioden im Longline-Trend abwechselnd erfassen. Die Stop-Loss-Stop-Setup kann gleichzeitig die Risikogewinne eines einzelnen Handels steuern.

Analyse der Stärken

  1. Es ist wichtig, die langfristigen Trends zu verfolgen, um einen positiven Trend zu verhindern und einen negativen Trend zu vermeiden.

  2. Die Long-Line-Indikatoren des Dongjian-Kanals und der EMA-Einheitsfilter helfen bei der Bestimmung der Trendrichtung.

  3. Die Schadensbegrenzungsmechanismen kontrollieren jedes einzelne Risiko und begrenzen die möglichen Verluste.

  4. Das Risiko-Gewinn-Verhältnis wird optimiert, die Verlust-Verhältnis wird erhöht, und es wird nach Übergewinne gesucht.

  5. Die Einstellung der Rückmeldparameter ist flexibel und ermöglicht eine optimale Kombination von Parametern für verschiedene Märkte.

Risikoanalyse

  1. Der Dongxian-Kanal und die EMA-Gleichlinie als Filterindikatoren könnten falsche Signale auslösen.

  2. Ein Durchbruch ist leicht zu erwischen und erfordert einen klaren Trendhintergrund.

  3. Die Stop-Loss-Stopp-Distanz ist festgelegt und kann nicht an Marktschwankungen angepasst werden.

  4. Parameters Die Optimierungsmöglichkeiten sind begrenzt und die Festplattenwirkung ist nicht garantiert.

  5. Das Trading-System ist nicht in der Lage, zu viele zufällige Ereignisse zu bewältigen, und ein Black Swan-Ereignis kann zu großen Verlusten führen.

Optimierungsrichtung

  1. Es kann in Erwägung gezogen werden, weitere Indikatoren zu filtern, z. B. Schwingungsindikatoren, um die Signalqualität zu verbessern.

  2. Es ist möglich, einen intelligenten Stop-Loss-Stop einzurichten, um die Verlustposition an die Marktfluktuation und die Dynamik des ATR-Indikators anzupassen.

  3. Methoden wie maschinelles Lernen können verwendet werden, um die Parameter zu testen und zu optimieren, um sie näher an den realen Markt zu bringen.

  4. Die Einstiegslogik kann optimiert werden, indem die VOLUME- oder Schwankungsrate-Anzeige als Hilfsbedingung eingestellt wird, um Fallen zu vermeiden.

  5. Eine Kombination mit Trend-Tracking-Strategien oder maschinellem Lernen kann in eine Hybrid-Strategie umgewandelt werden, um die Stabilität zu verbessern.

Zusammenfassen

Diese Strategie ist eine Tracking-Break-Strategie, deren Kernidee darin besteht, den Langstrecken-Trend zu beurteilen, um den Durchbruch als Signal zu nutzen und die Stop-Loss-Stop-Lösung für das Risiko eines einzelnen Handels einzurichten. Diese Strategie hat einige Vorteile, aber es gibt auch einige Optimierungsmöglichkeiten. Insgesamt kann die Strategie eine praktische Trend-Tracking-Strategie sein, wenn sie mit Parameter-Einstellung, Einstiegszeit-Auswahl und anderen Technologien verbunden ist.
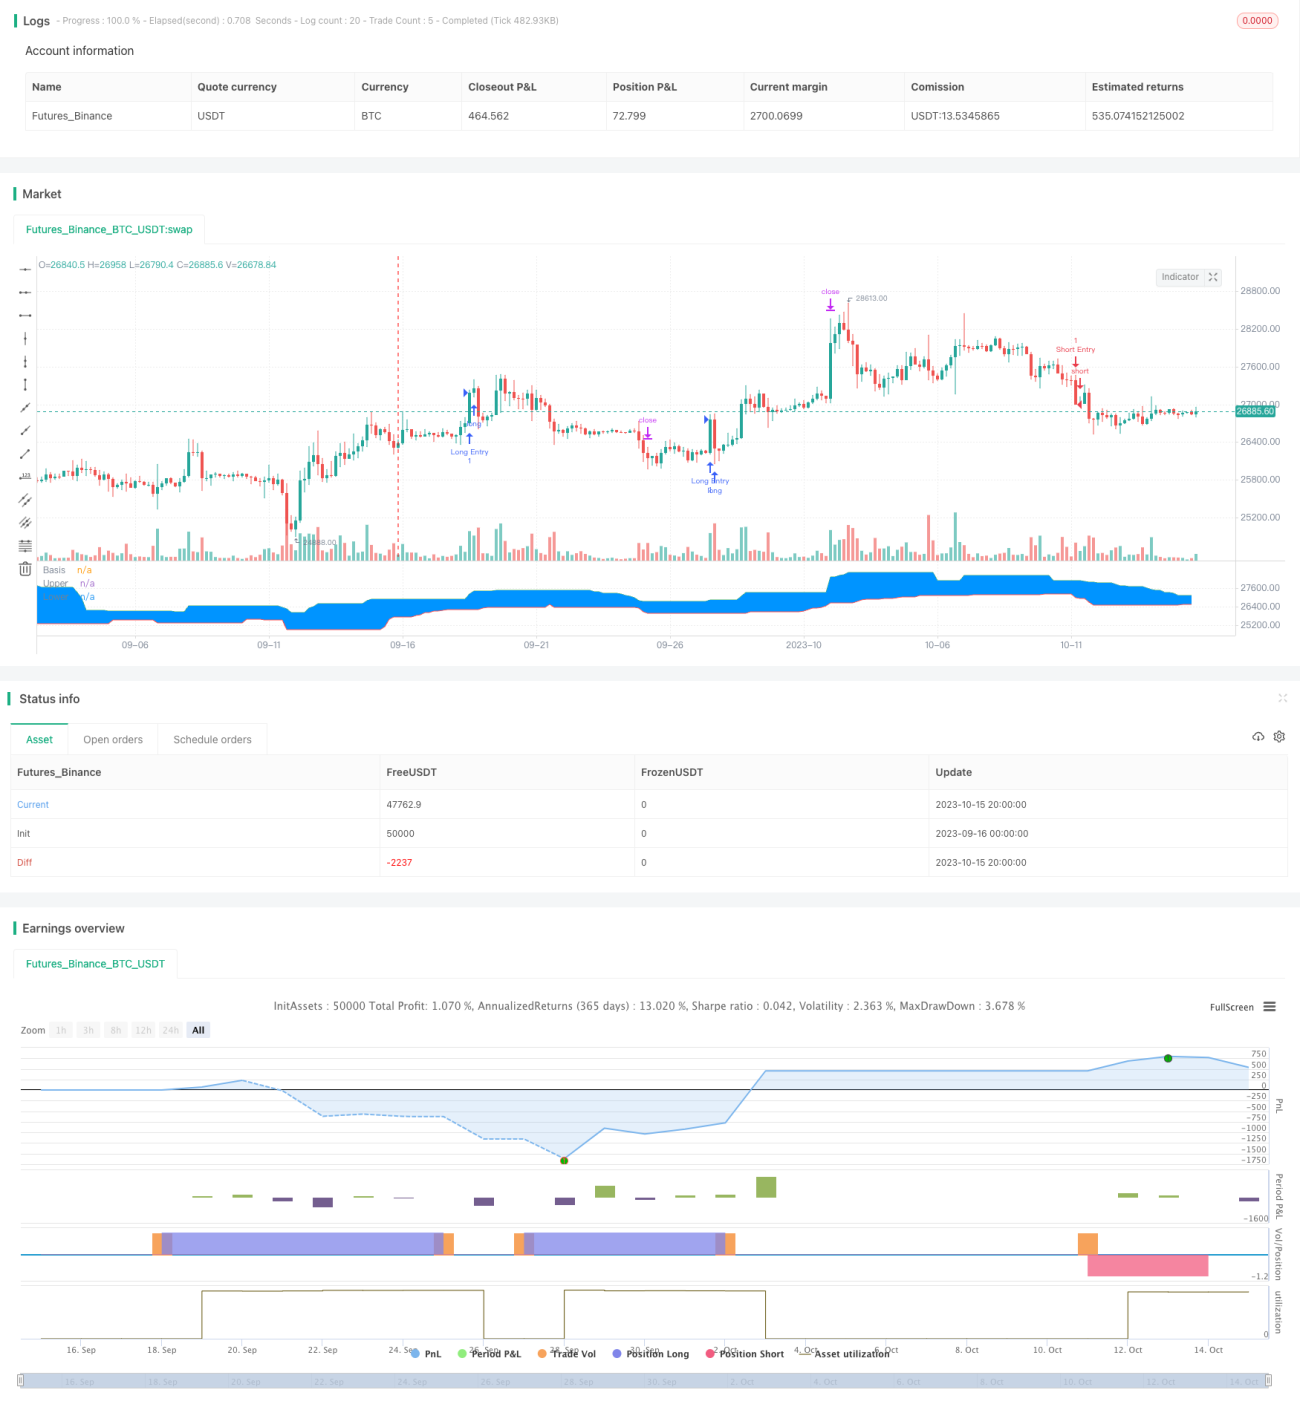
Strategiequellcode
/*backtest
start: 2023-09-16 00:00:00
end: 2023-10-16 00:00:00
period: 4h
basePeriod: 15m
exchanges: [{"eid":"Futures_Binance","currency":"BTC_USDT"}]
*/

//@version=4
// Welcome to my second script on Tradingview with Pinescript
// First of, I'm sorry for the amount of comments on this script, this script was a challenge for me, fun one for sure, but I wanted to thoroughly go through every step before making the script public
// Glad I did so because I fixed some weird things and I ended up forgetting to add the EMA into the equation so our entry signals were a mess
// This one was a lot tougher to complete compared to my MACD crossover trend strategy but I learned a ton from it, which is always good and fun
// Also I'll explain the strategy and how I got there through some creative coding(I'm saying creative because I had to figure this stuff out by myself as I couldn't find any reference codes)
// First things first. This is a Donchian Channel Breakout strategy which follows the following rules
// If the price hits the upperband of the Donchian Channel + price is above EMA and the price previously hit the lowerband of the Donchian Channel it's a buy signal
// If the price hits the lowerband of the Donchian Channel + price is below EMA and the price prevbiously hit the upper band of the Donchian Channel it's a sell signal
// Stop losses are set at the lower or upper band with a 0.5% deviation because we are acting as if those two bands are the resistance in this case
// Last but not least(yes, this gave BY FAR the most trouble to code), the profit target is set with a 1.5 risk to reward ratio
// If you have any suggestions to make my code more efficient, I'll be happy to hear so from you
// So without further ado, let's walk through the code

// The first line is basically standard because it makes backtesting so much more easy, commission value is based on Binance futures fees when you're using BNB to pay those fees in the futures market
// strategy(title="Donchian Channels", shorttitle="DC", overlay=true, default_qty_type = strategy.cash, default_qty_value = 150, initial_capital = 1000, currency = currency.USD, commission_type = "percent", commission_value = 0.036)
// The built-in Donchian Channels + an added EMA input which I grouped with the historical bars from the Donchian Channels
length          = input(20, minval=1, group = "Indicators")
lower           = lowest(length)
upper           = highest(length)
basis           = avg(upper, lower)
emaInput        = input(title = "EMA Input", type = input.integer, defval = 200, minval = 10, maxval = 400, step = 1, group = "Indicators")
// I've made three new inputs, for risk/reward ratio and for the standard pullback deviation. My advise is to not use the pullback inputs as I'm not 100% sure if they work as intended or not
riskreward      = input(title = "Risk/Reward Ratio", type = input.float, defval = 1.50, minval = 0.01, maxval = 100, step = 0.01, group = "Risk/Reward")
pullbackLong    = input(title = "Distance from Long pullback %", type = input.float, defval = 0.995, minval = 0.001, maxval = 2, step = 0.001, group = "Risk/Reward")
pullbackShort   = input(title = "Distance from Short pullback %", type = input.float, defval = 1.005, minval = 0.001, maxval = 2, step = 0.001, group = "Risk/Reward")

// Input backtest range, you can adjust these in the input options, just standard stuff
fromMonth       = input(defval = 1,    title = "From Month",      type = input.integer, minval = 1, maxval = 12, group = "Backtest Date Range")
fromDay         = input(defval = 1,    title = "From Day",        type = input.integer, minval = 1, maxval = 31, group = "Backtest Date Range")
fromYear        = input(defval = 2000, title = "From Year",       type = input.integer, minval = 1970,           group = "Backtest Date Range")
thruMonth       = input(defval = 1,    title = "Thru Month",      type = input.integer, minval = 1, maxval = 12, group = "Backtest Date Range")
thruDay         = input(defval = 1,    title = "Thru Day",        type = input.integer, minval = 1, maxval = 31, group = "Backtest Date Range")
thruYear        = input(defval = 2099, title = "Thru Year",       type = input.integer, minval = 1970,           group = "Backtest Date Range")
// Date variable also standard stuff
inDataRange     = (time >= timestamp(syminfo.timezone, fromYear, fromMonth, fromDay, 0, 0)) and (time < timestamp(syminfo.timezone, thruYear, thruMonth, thruDay, 0, 0))

// I had to makes these variables because the system has to remember whether the previous 'breakout' was a high or a low
// Also, because I based my stoploss on the upper/lower band of the indicator I had to find a way to change this value just once without losing the value, that was added, on the next bar
var previousishigh = false
var previousislow = false
var longprofit = 0.0
var shortprofit = 0.0
var stoplossLong = 0.0
var stoplossShort = 0.0
// These are used as our entry variables
emaCheck = ema(close, emaInput)
longcond = high >= upper and close > emaCheck
shortcond = low <= lower and close < emaCheck

// With these two if statements I'm changing the boolean variable above to true, we need this to decide out entry position
if high >= upper
    previousishigh := true
if low <= lower
    previousislow := true

// Made a last minute change on this part. To clean up our entry signals we don't want our breakouts, while IN a position, to change. This way we do not instantly open a new position, almost always in the opposite direction, upon exiting one
if strategy.position_size > 0 or strategy.position_size < 0 
    previousishigh := false
    previousislow := false

// Strategy inputs
// Long - previous 'breakout' has to be a low, the current price has to be a new high and above the EMA, we're not allowed to be in a position and ofcourse it has to be within our given data for backtesting purposes
if previousislow == true and longcond and strategy.position_size == 0 and inDataRange
    strategy.entry("Long Entry", strategy.long, comment = "Entry Long")
    stoplossLong := lower * pullbackLong
    longprofit := ((((1 - stoplossLong / close) * riskreward) + 1) * close)
    strategy.exit("Long Exit", "Long Entry", limit = longprofit, stop = stoplossLong, comment = "Long Exit")

// Short - Previous 'breakout' has to be a high, current price has to be a new low and lowe than the 200EMA, we're not allowed to trade when we're in a position and it has to be within our given data for backtesting purposes
if previousishigh == true and shortcond and strategy.position_size == 0 and inDataRange
    strategy.entry("Short Entry", strategy.short, comment = "Entry Short")
    stoplossShort := upper * pullbackShort
    shortprofit := (close - ((((1 - close / stoplossShort) * riskreward) * close)))
    strategy.exit("Short Exit", "Short Entry", limit = shortprofit, stop = stoplossShort, comment = "Short Exit")
    
// This plots the Donchian Channels on the chart which is just using the built-in Donchian Channels
plot(basis, "Basis", color=color.blue)
u = plot(upper, "Upper", color=color.green)
l = plot(lower, "Lower", color=color.red)
fill(u, l, color=#0094FF, transp=95, title="Background")

// These plots are to show if the variables are working as intended, it's a mess I know but I didn't have any better ideas, they work well enough for me
// plot(previousislow ? close * 0.95 : na, color=color.red, linewidth=2, style=plot.style_linebr)
// plot(previousishigh ? close * 1.05 : na, color=color.green, style=plot.style_linebr)
// plot(longprofit, color=color.purple)
// plot(shortprofit, color=color.silver)
// plot(stoplossLong)
// plot(stoplossShort)
// plot(strategy.position_size)