
Die Strategie nutzt eine Kombination aus mehreren grundlegenden Formindikatoren, um die Zeit für eine starke Umkehr zu identifizieren, und verfolgt eine Trend-Stopp-Strategie, die darauf abzielt, mehr zu gewinnen als zu stoppen.
Die Strategie basiert auf folgenden Indikatoren, um eine Bottom-up-Umkehr zu bestimmen:
Noro’s BottomSensivity: Beurteilt, ob eine bestimmte Bottomform auf der K-Linie auftritt.
Der Index der Bestimmtheitsbereitschaft (CVI): Beurteilung der Transformation der Mehrraumpsychologie.
Der Endindikator ((UCS): Beurteilung der Abweichung von der Durchschnittslinie.
Der RSI: Überverkauf.
Formkombination: umfasst mehrere Unterformen, wie z. B. Schrägstücke, Figuren und ähnliches.
Die Strategie verwendet mehrere Kombinationen von Basisindikatoren, um ein Kaufsignal zu erzeugen, wenn die Anzahl der Basisformate, die für die Strategieparameter festgelegt ist, erfüllt wird. Zur Filterung falscher Durchbrüche wird die Strategie auch die RSI-Indikatorentscheidung hinzugefügt, die nur bei Überverkauf ein Kauf auslöst.
Die Benutzer können die Verwendung und die Parameter der einzelnen unteren Beurteilungsindikatoren konfigurieren, was eine hohe Flexibilität ermöglicht. Die Strategie enthält auch eine SMA-Gleichgewichtsfilterung, um zu vermeiden, dass sie unter dem Trend liegt.
Mehrfache Indikatoren zur Gewissheit
Anpassbare Kennwerte für verschiedene Sorten
SMA-Gleichfilterung, Vermeidung von Überschneidungen
Eintritt nur auf der roten K-Linie, um das Risiko zu verringern
Mit einem Pop-up-Alarm und einer Echtzeitüberwachung
Mehrfaches Kombi-Gutachten könnte den Tiefpunkt übersehen haben
Die Grundform muss sich nicht ständig umdrehen
Es ist wichtig, sich darauf zu konzentrieren, ob die Umkehrung durch den Umsatz unterstützt werden kann.
Optimierung der Parameterkonfiguration der Kennzahlen und Anpassung an die verschiedenen Sorten
Erhöhung der Lagerhaltung und Senkung der Kosten durch Lagerhaltung
Erhöhung der Stop-Loss-Strategie und Verfolgung von Trendstop-Losses
Die Strategie nutzt mehrere Indikatoren, um die Basis zu verbessern und die Gewinne zu verringern. Die Risiken können durch Trendverfolgung und Stop-Loss-Lock-in effektiv kontrolliert werden. Es ist jedoch wichtig zu beachten, ob das Handelsvolumen den Trend umkehren kann.
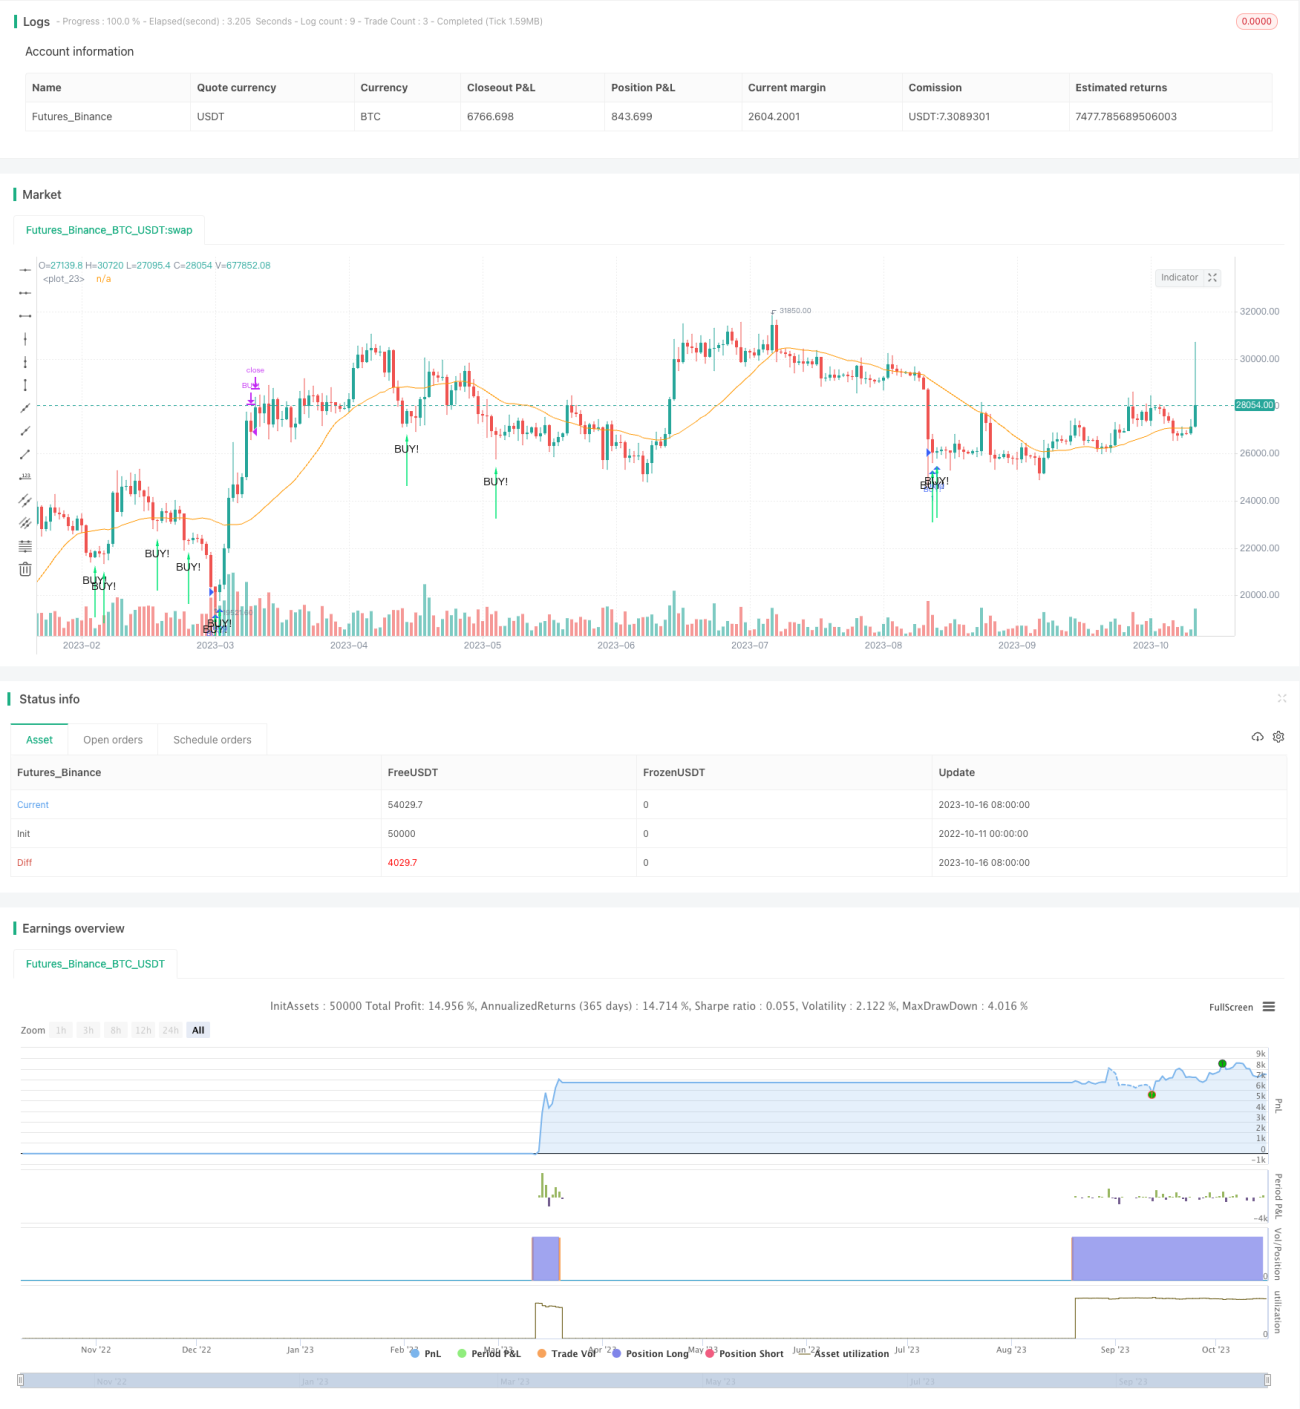
/*backtest
start: 2022-10-11 00:00:00
end: 2023-10-17 00:00:00
period: 1d
basePeriod: 1h
exchanges: [{"eid":"Futures_Binance","currency":"BTC_USDT"}]
*/
// the original indicator is Noro's BottomSensivity v0.6
//@version=4
strategy("Noro's BottomSensivity v0.6 strategy + rsi + Alarm", shorttitle="Bottom 0.6 StRsiAlarm", overlay=true)
overSold = input(35)
overBought = input(70)
botsens = input(defval = 3, minval = 1, maxval = 4, title = "Bottom-Sensivity")
smalen = input(defval = 25, minval = 20, maxval = 200, title = "SMA Length")
bars = input(defval = 3, minval = 2, maxval = 4, title = "Bars of Locomotive")
useloc = input(true, title = "Use bottom-pattern Locomotive?")
usepin = input(true, title = "Use bottom-pattern Pin-bar?")
usecvi = input(true, title = "Use bottom-indicator CVI?")
useucs = input(true, title = "Use bottom-indicator UCS?")
usevix = input(true, title = "Use bottom-indicator WVF?")
usersi = input(true, title = "Use bottom-indicator RSI?")
usered = input(false, title = "Only red candles?")
usesma = input(true, title = "Use SMA Filter?")
showsma = input(false, title = "Show SMA Filter?")
//SMA Filter
sma = sma(close, smalen)
colsma = showsma == true ? red : na
plot(sma, color = colsma)
//VixFix method
//Start of ChrisMoody's code
pd = 22
bbl = 20
mult = 2
lb = 50
ph = .85
pl = 1.01
hp = false
sd = false
wvf = ((highest(close, pd)-low)/(highest(close, pd)))*100
sDev = mult * stdev(wvf, bbl)
midLine = sma(wvf, bbl)
lowerBand = midLine - sDev
upperBand = midLine + sDev
rangeHigh = (highest(wvf, lb)) * ph
rangeLow = (lowest(wvf, lb)) * pl
//End of ChrisMoody's code
//Locomotive mmethod
bar = close > open ? 1 : close < open ? -1 : 0
locob = bar == 1 and bar[1] == -1 and bar[2] == -1 and (bar[3] == -1 or bars < 3) and (bar[4] == -1 or bars < 4) ? 1 : 0
//PIN BAR
body = abs(close - open)
upshadow = open > close? (high - open) : (high - close)
downshadow = open > close ? (close - low) : (open - low)
pinbar = open[1] > close[1] ? (body[1] > body ? (downshadow > 0.5 * body ? (downshadow > 2 * upshadow ? 1 : 0 ) : 0 ) : 0 ) : 0
//CVI method
//Start of LazyBear's code
ValC=sma(hl2, 3)
bull=-.51
bear=.43
vol=sma(atr(3), 3)
cvi = (close-ValC) / (vol*sqrt(3))
cb= cvi <= bull ? green : cvi >=bear ? red : cvi > bull ? blue : cvi < bear ? blue : na
bull1 = cvi <= bull
bear1 = cvi >= bear
bull2 = bull1[1] and not bull1
bear2 = bear1[1] and not bear1
//End of LazyBear's code
//UCS method
//Start of UCS's code
ll = lowest(low, 5)
hh = highest(high, 5)
diff = hh - ll
rdiff = close - (hh+ll)/2
avgrel = ema(ema(rdiff,3),3)
avgdiff = ema(ema(diff,3),3)
mom = ((close - close[3])/close[3])*1000
SMI = avgdiff != 0 ? (avgrel/(avgdiff/2)*100) : 0
SMIsignal = ema(SMI,3)
ucslong = SMI < -35 and mom > 0 and mom[1] < 0 ? 1 : 0
//End of UCS's code
//RSI method
//Chris Moody's code
up = rma(max(change(close), 0), 2)
down = rma(-min(change(close), 0), 2)
rsi = down == 0 ? 100 : up == 0 ? 0 : 100 - (100 / (1 + up / down))
rsib = rsi < 10 ? 1 : 0
//Chris Moody's code
//sum
locobot = useloc == false ? 0 : locob
vixfixbot = usevix == false ? 0 : wvf >= upperBand or wvf >= rangeHigh ? 1 : 0
cvibot = usecvi == false ? 0 : bull2 == true ? 1 : 0
ucsbot = useucs == false ? 0 : ucslong == 1 ? 1 : 0
rsibot = usersi == false ? 0 : rsib
pinbot = usepin == false ? 0 : pinbar
score = vixfixbot + locobot + cvibot + ucsbot + rsibot + pinbot
//arrows
bottom = usered == false ? usesma == false ? score >= botsens ? 1 : 0 : high < sma and score >= botsens ? 1 : 0 : usesma == false ? score >= botsens and close < open ? 1 : 0 : high < sma and score >= botsens and close < open ? 1 : 0
plotarrow(bottom == 1 ? 1 : na, title="Buy arrow", colorup=lime, maxheight=60, minheight=50, transp=0)
data = bottom == 1
plotchar(data, char=" ", text="BUY!", location=location.belowbar, color=green, size=size.small)
//Market buy and exit
strategy.entry("BUY!", strategy.long, when =(bottom == 1) and(rsi(close,14)<overSold))
strategy.close("BUY!", when = (crossunder(rsi(close,14), overBought)))
alarm = bottom == 1 and(rsi(close,14)<overSold)
alertcondition(alarm == 1,title="BUY+RSI",message="BUY+RSI")