
Die Strategie kombiniert die Vorzüge der Breakout-Strategie und der Trend-Tracking-Stopp-Strategie, um das Signal eines Breakouts der Resistenz-Unterstützung in einem Long-Line-Graphik zu erfassen und gleichzeitig den Stop-Tracking mit Hilfe eines Moving Averages zu ermöglichen, um in der Richtung des Long-Line-Trends zu profitieren und gleichzeitig das Risiko zu kontrollieren.
Die Strategie berechnet zunächst einen Moving Average für mehrere Gruppen verschiedener Parameter, die jeweils als Trendbeurteilung, Unterstützungswiderstand und Verlustverfolgung verwendet werden.
Dann finden Sie die höchsten und niedrigsten Punkte innerhalb des angegebenen Zeitraums, die als Unterstützungs- und Widerstandsbereiche eingesetzt werden. Die Signale werden erzeugt, wenn der Preis diese Unterstützungs- und Widerstandsbereiche durchbricht.
Die Strategie besteht darin, zu kaufen, um mehrere Signale für den Durchbruch der Höchststände zu machen, und zu verkaufen, um die niedrigsten Punkte für den Durchbruch der Kurzstände zu machen.
Nach dem Eintritt wird die Position mit dem niedrigsten Punkt des Breakout-Tiefs als Stop-Loss-Bereich gehalten.
Sobald die Position gewinnbringend ist, wird der Stop-Loss auf den Moving Average übertragen. Wenn der Preis den Moving Average überschreitet, wird der Stop-Loss als der niedrigste Punkt dieser K-Linie festgelegt.
So kann der Gewinn gesichert werden, während die Position genügend Platz hat, um den Trend zu verfolgen.
Die Strategie beinhaltet auch die durchschnittliche reale Schwankung, um sicherzustellen, dass nur in geeigneten Bereichen ein Kaufbruch erfolgt, um zu vermeiden, dass eine übermäßige Expansion eintritt.
Die Kombination aus Breakthrough-Strategie und Trend-Tracking-Strategie bietet den doppelten Vorteil der Stop Loss-Strategie.
Es ist möglich, dass ein Unternehmen, das sich auf eine langfristige Trendlinie stützt, einen Durchbruch erwirbt, um die Gewinnchancen zu erhöhen.
Die Stop-Loss-Strategie schützt die Position und gibt der Position genügend Spielraum.
Ein unvorteilhafter Durchbruch, der zu starke Erhöhungen verhindert, wird durch einen Fluktuationsfilter verhindert.
Automatisierte Transaktionen für Teilzeit-Bilanzen.
Die Betriebsmittellinie kann für verschiedene Perioden benutzerdefiniert werden.
Die Verlustverfolgung kann flexibel angepasst werden.
Durchbrechungsstrategien sind anfällig für die Gefahr von falschen Durchbrüchen. Durchbrechungsbestätigungen können angemessen gelockert werden.
Es wird genügend Schwankungen benötigt, um ein Durchbruchsignal zu erzeugen, das in einem umgekehrten Fall leicht ungültig ist.
Einige Durchbrüche könnten zu kurz sein, um sie zu erfassen.
Tracking-Stopps können bei Störungen zu häufig ausfallen. Die Stoppdistanz kann entsprechend gelockert werden.
Die Fluktuationsrate-Filterung kann einige Chancen verpassen. Sie können die Filterparameter reduzieren.
Versuche verschiedene Kombinationen von Mittellinienparametern, um die optimale Parameter zu finden.
Verschiedene Mechanismen zur Durchbruchbestätigung, wie z. B. Kanäle, K-Linien-Formen usw. werden getestet.
Versuchen Sie verschiedene Stop-Loss-Tracking-Methoden, um den besten Stopp zu finden.
Optimierung von Geldmanagementstrategien wie Positon Score
Hinzugefügt wird ein Filter für statistische Techniken, um die Filtergenauigkeit zu verbessern.
Verschiedene Sorten werden getestet, um die Wirksamkeit der Strategie zu testen.
Die Einbindung von Machine Learning Algorithmen verbessert die Effektivität der Strategien.
Die Strategie integriert Breakthroughs und Trend-Tracking-Stopps und optimiert die Gewinnspanne, sofern die Longlines richtig beurteilt werden. Der Schlüssel ist, die beste Kombination von Parametern zu finden und mit einer guten Geldmanagementstrategie zu arbeiten, um die Longline-Gelegenheiten zu ergreifen und gleichzeitig das Risiko zu kontrollieren. Die Strategie wird durch weitere Optimierung zu einer zuverlässigen Longline-Trendstrategie werden.
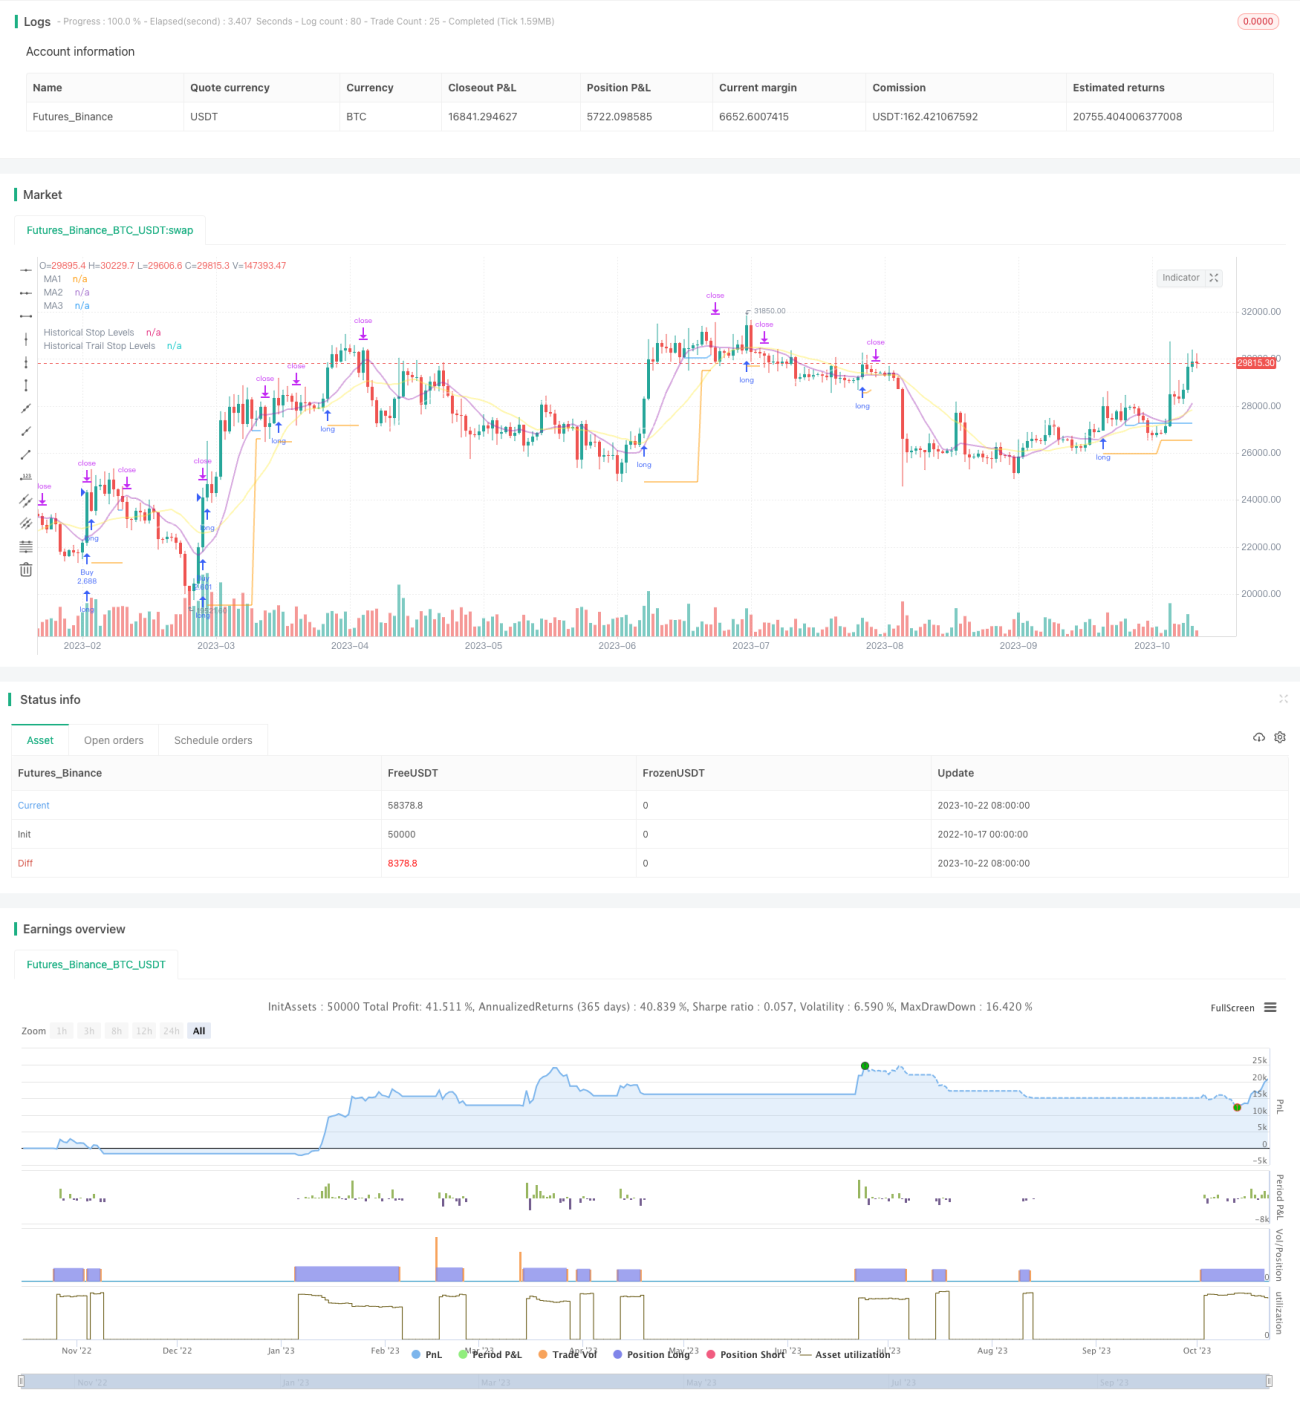
/*backtest
start: 2022-10-17 00:00:00
end: 2023-10-23 00:00:00
period: 1d
basePeriod: 1h
exchanges: [{"eid":"Futures_Binance","currency":"BTC_USDT"}]
*/
// This source code is subject to the terms of the Mozilla Public License 2.0 at https://mozilla.org/MPL/2.0/
// © millerrh
// The intent of this strategy is to buy breakouts with a tight stop on smaller timeframes in the direction of the longer term trend.
// Then use a trailing stop of a close below either the 10 MA or 20 MA (user choice) on that larger timeframe as the position
// moves in your favor (i.e. whenever position price rises above the MA).
// Option of using daily ADR as a measure of finding contracting ranges and ensuring a decent risk/reward.
// (If the difference between the breakout point and your stop level is below a certain % of ATR, it could possibly find those consolidating periods.)
// V2 - updates code of original Qullamaggie Breakout to optimize and debug it a bit - the goal is to remove some of the whipsaw and poor win rate of the
// original by incorporating some of what I learned in the Breakout Trend Follower script.
//@version=4
strategy("Qullamaggie Breakout V2", overlay=true, initial_capital=100000, currency='USD', calc_on_every_tick = true,
default_qty_type=strategy.percent_of_equity, default_qty_value=100, commission_type=strategy.commission.percent, commission_value=0.1)
// === BACKTEST RANGE ===
Start = input(defval = timestamp("01 Jan 2019 06:00 +0000"), title = "Backtest Start Date", type = input.time, group = "backtest window and pivot history")
Finish = input(defval = timestamp("01 Jan 2100 00:00 +0000"), title = "Backtest End Date", type = input.time, group = "backtest window and pivot history")
// Inputs
showPivotPoints = input(title = "Show Historical Pivot Points?", type = input.bool, defval = false, group = "backtest window and pivot history",
tooltip = "Toggle this on to see the historical pivot points that were used. Change the Lookback Periods to adjust the frequency of these points.")
htf = input(defval="D", title="Timeframe of Moving Averages", type=input.resolution, group = "moving averages",
tooltip = "Allows you to set a different time frame for the moving averages and your trailing stop.
The default behavior is to identify good tightening setups on a larger timeframe
(like daily) and enter the trade on a breakout occuring on a smaller timeframe, using the moving averages of the larger timeframe to trail your stop.")
maType = input(defval="SMA", options=["EMA", "SMA"], title = "Moving Average Type", group = "moving averages")
ma1Length = input(defval = 10, title = "1st Moving Average Length", minval = 1, group = "moving averages")
ma2Length = input(defval = 20, title = "2nd Moving Average Length", minval = 1, group = "moving averages")
ma3Length = input(defval = 50, title = "3rd Moving Average Length", minval = 1, group = "moving averages")
useMaFilter = input(title = "Use 3rd Moving Average for Filtering?", type = input.bool, defval = true, group = "moving averages",
tooltip = "Signals will be ignored when price is under this slowest moving average. The intent is to keep you out of bear periods and only
buying when price is showing strength or trading with the longer term trend.")
trailMaInput = input(defval="1st Moving Average", options=["1st Moving Average", "2nd Moving Average"], title = "Trailing Stop", group = "stops",
tooltip = "Initial stops after entry follow the range lows. Once in profit, the trade gets more wiggle room and
stops will be trailed when price breaches this moving average.")
trailMaTF = input(defval="Same as Moving Averages", options=["Same as Moving Averages", "Same as Chart"], title = "Trailing Stop Timeframe", group = "stops",
tooltip = "Once price breaches the trail stop moving average, the stop will be raised to the low of that candle that breached. You can choose to use the
chart timeframe's candles breaching or use the same timeframe the moving averages use. (i.e. if daily, you wait for the daily bar to close before setting
your new stop level.)")
currentColorS = input(color.new(color.orange,50), title = "Current Range S/R Colors: Support", type = input.color, group = "stops", inline = "lineColor")
currentColorR = input(color.new(color.blue,50), title = " Resistance", type = input.color, group = "stops", inline = "lineColor")
// Pivot lookback
lbHigh = 3
lbLow = 3
// MA Calculations (can likely move this to a tuple for a single security call!!)
ma(maType, src, length) =>
maType == "EMA" ? ema(src, length) : sma(src, length) //Ternary Operator (if maType equals EMA, then do ema calc, else do sma calc)
ma1 = security(syminfo.tickerid, htf, ma(maType, close, ma1Length))
ma2 = security(syminfo.tickerid, htf, ma(maType, close, ma2Length))
ma3 = security(syminfo.tickerid, htf, ma(maType, close, ma3Length))
plot(ma1, color=color.new(color.purple, 60), style=plot.style_line, title="MA1", linewidth=2)
plot(ma2, color=color.new(color.yellow, 60), style=plot.style_line, title="MA2", linewidth=2)
plot(ma3, color=color.new(color.white, 60), style=plot.style_line, title="MA3", linewidth=2)
// === USE ADR FOR FILTERING ===
// The idea here is that you want to buy in a consolodating range for best risk/reward. So here you can compare the current distance between
// support/resistance vs. the ADR and make sure you aren't buying at a point that is too extended.
useAdrFilter = input(title = "Use ADR for Filtering?", type = input.bool, defval = false, group = "adr filtering",
tooltip = "Signals will be ignored if the distance between support and resistance is larger than a user-defined percentage of ADR (or monthly volatility
in the stock screener). This allows the user to ensure they are not buying something that is too extended and instead focus on names that are consolidating more.")
adrPerc = input(defval = 120, title = "% of ADR Value", minval = 1, group = "adr filtering")
tableLocation = input(defval="Bottom", options=["Top", "Bottom"], title = "ADR Table Visibility", group = "adr filtering",
tooltip = "Place ADR table on the top of the pane, the bottom of the pane, or off.")
adrValue = security(syminfo.tickerid, "D", sma((high-low)/abs(low) * 100, 21)) // Monthly Volatility in Stock Screener (also ADR)
adrCompare = (adrPerc * adrValue) / 100
// === PLOT SWING HIGH/LOW AND MOST RECENT LOW TO USE AS STOP LOSS EXIT POINT ===
ph = pivothigh(high, lbHigh, lbHigh)
pl = pivotlow(low, lbLow, lbLow)
highLevel = valuewhen(ph, high[lbHigh], 0)
lowLevel = valuewhen(pl, low[lbLow], 0)
barsSinceHigh = barssince(ph) + lbHigh
barsSinceLow = barssince(pl) + lbLow
timeSinceHigh = time[barsSinceHigh]
timeSinceLow = time[barsSinceLow]
//Removes color when there is a change to ensure only the levels are shown (i.e. no diagonal lines connecting the levels)
pvthis = fixnan(ph)
pvtlos = fixnan(pl)
hipc = change(pvthis) != 0 ? na : color.new(color.maroon, 0)
lopc = change(pvtlos) != 0 ? na : color.new(color.green, 0)
// Display Pivot lines
plot(showPivotPoints ? pvthis : na, color=hipc, linewidth=1, offset=-lbHigh, title="Top Levels")
plot(showPivotPoints ? pvthis : na, color=hipc, linewidth=1, offset=0, title="Top Levels 2")
plot(showPivotPoints ? pvtlos : na, color=lopc, linewidth=1, offset=-lbLow, title="Bottom Levels")
plot(showPivotPoints ? pvtlos : na, color=lopc, linewidth=1, offset=0, title="Bottom Levels 2")
// BUY AND SELL CONDITIONS
buyLevel = valuewhen(ph, high[lbHigh], 0) //Buy level at Swing High
// Conditions for entry
stopLevel = float(na) // Define stop level here as "na" so that I can reference it in the ADR calculation before the stopLevel is actually defined.
buyConditions = (useMaFilter ? buyLevel > ma3 : true) and
(useAdrFilter ? (buyLevel - stopLevel[1]) < adrCompare : true)
buySignal = crossover(high, buyLevel) and buyConditions
// Trailing stop points - when price punctures the moving average, move stop to the low of that candle - Define as function/tuple to only use one security call
trailMa = trailMaInput == "1st Moving Average" ? ma1 : ma2
f_getCross() =>
maCrossEvent = crossunder(low, trailMa)
maCross = valuewhen(maCrossEvent, low, 0)
maCrossLevel = fixnan(maCross)
maCrossPc = change(maCrossLevel) != 0 ? na : color.new(color.blue, 0) //Removes color when there is a change to ensure only the levels are shown (i.e. no diagonal lines connecting the levels)
[maCrossEvent, maCross, maCrossLevel, maCrossPc]
crossTF = trailMaTF == "Same as Moving Averages" ? htf : ""
[maCrossEvent, maCross, maCrossLevel, maCrossPc] = security(syminfo.tickerid, crossTF, f_getCross())
plot(showPivotPoints ? maCrossLevel : na, color = maCrossPc, linewidth=1, offset=0, title="Ma Stop Levels")
// == STOP AND PRICE LEVELS ==
inPosition = strategy.position_size > 0
buyLevel := inPosition ? buyLevel[1] : buyLevel
stopDefine = valuewhen(pl, low[lbLow], 0) //Stop Level at Swing Low
inProfit = strategy.position_avg_price <= stopDefine[1]
// stopLevel := inPosition ? stopLevel[1] : stopDefine // Set stop loss based on swing low and leave it there
stopLevel := inPosition and not inProfit ? stopDefine : inPosition and inProfit ? stopLevel[1] : stopDefine // Trail stop loss until in profit
trailStopLevel = float(na)
// trying to figure out a better way for waiting on the trail stop - it can trigger if above the stopLevel even if the MA hadn't been breached since opening the trade
notInPosition = strategy.position_size == 0
inPositionBars = barssince(notInPosition)
maCrossBars = barssince(maCrossEvent)
trailCross = inPositionBars > maCrossBars
// trailCross = trailMa > stopLevel
trailStopLevel := inPosition and trailCross ? maCrossLevel : na
plot(inPosition ? stopLevel : na, style=plot.style_linebr, color=color.new(color.orange, 50), linewidth = 2, title = "Historical Stop Levels", trackprice=false)
plot(inPosition ? trailStopLevel : na, style=plot.style_linebr, color=color.new(color.blue, 50), linewidth = 2, title = "Historical Trail Stop Levels", trackprice=false)
// == PLOT SUPPORT/RESISTANCE LINES FOR CURRENT CHART TIMEFRAME ==
// Use a function to define the lines
// f_line(x1, y1, y2, _color) =>
// var line id = na
// line.delete(id)
// id := line.new(x1, y1, time, y2, xloc.bar_time, extend.right, _color)
// highLine = f_line(timeSinceHigh, highLevel, highLevel, currentColorR)
// lowLine = f_line(timeSinceLow, lowLevel, lowLevel, currentColorS)
// == ADR TABLE ==
tablePos = tableLocation == "Top" ? position.top_right : position.bottom_right
var table adrTable = table.new(tablePos, 2, 1, border_width = 3)
lightTransp = 90
avgTransp = 80
heavyTransp = 70
posColor = color.rgb(38, 166, 154)
negColor = color.rgb(240, 83, 80)
volColor = color.new(#999999, 0)
f_fillCellVol(_table, _column, _row, _value) =>
_transp = abs(_value) > 7 ? heavyTransp : abs(_value) > 4 ? avgTransp : lightTransp
_cellText = tostring(_value, "0.00") + "%\n" + "ADR"
table.cell(_table, _column, _row, _cellText, bgcolor = color.new(volColor, _transp), text_color = volColor, width = 6)
srDistance = (highLevel - lowLevel)/highLevel * 100
f_fillCellCalc(_table, _column, _row, _value) =>
_c_color = _value >= adrCompare ? negColor : posColor
_transp = _value >= adrCompare*0.8 and _value <= adrCompare*1.2 ? lightTransp :
_value >= adrCompare*0.5 and _value < adrCompare*0.8 ? avgTransp :
_value < adrCompare*0.5 ? heavyTransp :
_value > adrCompare*1.2 and _value <= adrCompare*1.5 ? avgTransp :
_value > adrCompare*1.5 ? heavyTransp : na
_cellText = tostring(_value, "0.00") + "%\n" + "Range"
table.cell(_table, _column, _row, _cellText, bgcolor = color.new(_c_color, _transp), text_color = _c_color, width = 6)
if barstate.islast
f_fillCellVol(adrTable, 0, 0, adrValue)
f_fillCellCalc(adrTable, 1, 0, srDistance)
// f_fillCellVol(adrTable, 0, 0, inPositionBars)
// f_fillCellCalc(adrTable, 1, 0, maCrossBars)
// == STRATEGY ENTRY AND EXIT ==
strategy.entry("Buy", strategy.long, stop = buyLevel, when = buyConditions)
stop = stopLevel > trailStopLevel ? stopLevel : close[1] > trailStopLevel and close[1] > trailMa ? trailStopLevel : stopLevel
strategy.exit("Sell", from_entry = "Buy", stop=stop)