Kurzfristige Trendstrategie basierend auf mehrdimensionaler Entscheidungsfindung anhand von Indikatoren

Überblick
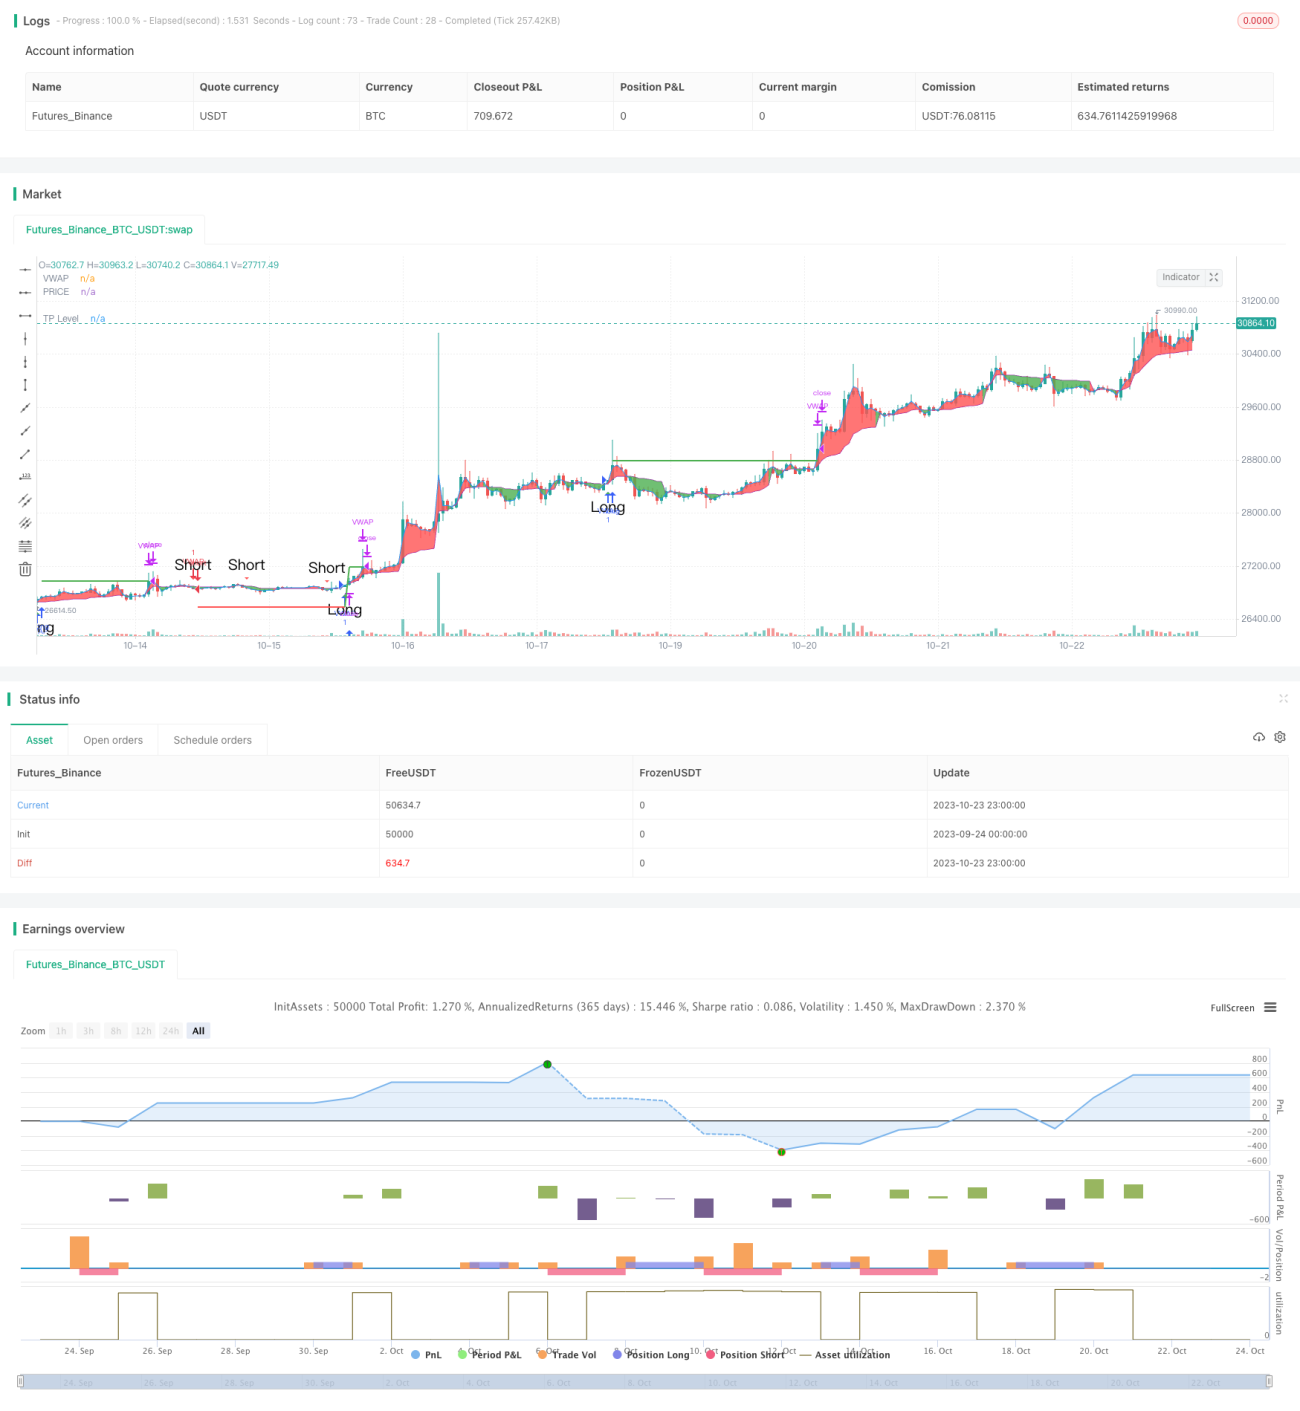
Die Strategie kombiniert drei verschiedene Dimensionen der technischen Indikatoren, die Unterstützung der Resistance, der Mittellinien-System und der Überkauf-Überverkauf-Indikator, um die Richtung der kurzfristigen Trends anhand ihrer synthetischen Signale zu bestimmen, um eine höhere Gewinnquote zu erzielen.
Strategieprinzip
Der Code berechnet zunächst die Unterstützungs- und Widerstandsplätze des Preises, einschließlich der Standard-Oscillation-Achse und der Fibonacci-Unterstützungs- und Widerstandsplätze, und zeichnet sie auf einer Grafik. Wenn der Preis diese wichtigen Punkte durchbricht, wird dies als ein wichtiges Trendsignal angesehen.
Dann berechnen wir die gewichteten Moving Averages VWAP und Mean Pricing und beurteilen die Gold-Cross- und Dead-Fork-Signale. Das ist eine mittelfristige Trendbeurteilung.
Letztendlich wird der Stochastic RSI berechnet, um zu beurteilen, ob es sich um ein Gold-Cross- und ein Dead Fork-Signal handelt, das zu einem Überkauf-Überverkauf-Indikator gehört.
Wenn die Unterstützung des Widerstands, der VWAP-Gehalt und der stochastische RSI gleichzeitig ein Kaufsignal senden, wird ein Überkauf getätigt. Wenn alle drei gleichzeitig ein Verkaufsignal senden, wird ein Leerverkauf getätigt.
Analyse der Stärken
Der größte Vorteil dieser Strategie besteht darin, dass die Kombination von drei verschiedenen Dimensionen der Indikatoren, so dass die Beurteilung mehr umfassende Genauigkeit, eine höhere Gewinnrate. Zuerst unterstützt die Widerstandsstufe große Trends zu beurteilen; dann VWAP Beurteilung der mittleren langen Trend; und schließlich Stochastic RSI überkaufen Überverkauf zu beurteilen. Die dreidimensionalen Indikatoren gleichzeitig Signale senden, können weitgehend zu filtern falsche Signale, die Erfolgsrate der Eintritt verbessern.
Außerdem bietet die Strategie eine Stop-Loss-Funktion, mit der ein bestimmter Prozentsatz des Ertrags gesperrt werden kann, was der Geldverwaltung zugute kommt.
Risikoanalyse
Das Hauptrisiko dieser Strategie besteht darin, dass die Obergrenzenentscheidung auf die Synchronisierung der Indikatoren angewiesen ist. Wenn einige der Indikatoren falsche Signale senden, kann dies zu einem Entscheidungsfehler führen. Zum Beispiel gibt der stochastische RSI ein Überkaufsignal, aber die VWAP- und Unterstützungswiderstandsbeurteilung ist immer noch pessimistisch.
Außerdem kann eine falsche Einstellung der Indikatorparameter zu Fehleinschätzungen führen. Die optimale Parameter müssen durch wiederholte Rückmessungen ermittelt werden.
Darüber hinaus gibt es in der Börse in kurzer Zeit häufig schwarze Schwimmereignisse, die zu einer Ausfallentwicklung der Indikatoren führen. Um dieses Risiko zu vermeiden, kann eine Stop-Loss-Strategie eingesetzt werden, um zu große Einzelschäden zu vermeiden.
Optimierungsrichtung
Die Strategie kann in folgenden Bereichen weiter optimiert werden:
-
Hinzu kommen weitere Kennzahlen wie die Transaktionsmenge, um die Stärke und Schwäche von Trends zu bestimmen und die Entscheidungsgenauigkeit zu verbessern.
-
Das Programm wurde in den USA entwickelt, um die Optimierung der Handelsstrategien zu erleichtern, die durch die Einführung von Machine Learning-Modellen und der Ausbildung von Multi-Dimensional-Indikatoren ermöglicht werden.
-
Optimierung nach verschiedenen Sortenparametern mit Anpassungsparametern.
-
Erhöhung der Stop-Loss-Strategie und bessere Risikokontrolle, basierend auf der Größe der Rücknahme-Kontrollposition.
-
Kombinationsoptimierung, die Suche nach weniger relevanten Sorten für die Kombination und die Verringerung der Kombinationsrückziehung.
Zusammenfassen
Die Strategie als Ganzes eignet sich hervorragend für den Handel mit kurzfristigen Trends. Sie nutzt mehrdimensionale Indikatoren für die Entscheidungsfindung, kann viel Lärm filtern und hat eine hohe Gewinnrate. Es besteht jedoch die Gefahr, dass die Indikatoren falsche Signale aussenden. Durch weitere Optimierung wird die Strategie als effiziente und stabile Kurzlinienstrategie erwartet.
- 1