RSI Long-Short Automatisierte Handelsstrategie

Überblick
Die Strategie basiert auf einem relativ starken (RSI) Indikator, der ein offenes automatisches Handelssystem entwickelt hat. Es kann automatisch ein offenes Signal geben, um automatisch zu handeln, wenn der RSI eine überkaufte überverkaufte Zone erreicht.
Strategieprinzip
Die Strategie erhält einen RSI-Wert im Bereich 0-100 durch Berechnung der Kursbewegungen der Aktien innerhalb eines bestimmten Zeitraums. Wenn der RSI unter 30 liegt, ist es ein Überverkauf, und wenn er über 70 liegt, ist es ein Überkauf. Die Strategie handelt nach dieser Regel, wenn der RSI die Überverkaufszone erreicht, wird automatisch verkauft, und wenn er die Überkaufszone erreicht, wird automatisch gekappt.
Konkret berechnet die Strategie zunächst den RSI-Wert für 15 Zyklen. Wenn der RSI unter 20 fällt, gilt er als Überverkauf, und wenn er den 200-Tage-Moving Average überschreitet, wird eine Übernahme getätigt. Wenn der RSI über 80 steigt, gilt er als Überkauf und wird ein Shorting getätigt.
Die Strategie erlaubt außerdem, die entsprechenden Markierungslinien und Tags zu zeichnen, wenn ein Preissignal auftritt, um das Handelssignal intuitiver zu gestalten.
Strategische Vorteile
- Strategie ist klar, einfach und leicht zu verstehen
- Die RSI-Indikatoren sind ein guter Indikator für Überkäufe und Überverkäufe.
- Vollständig automatisierte Transaktionen ohne menschliche Intervention
- Einstellung von Stop Losses und effektive Risikokontrolle
- Handelssignale sind intuitiv und leicht zu überwachen
Strategisches Risiko
- Der RSI weist eine gewisse Nachlässigkeit auf, die zu Fehleinschätzungen führen kann.
- Die festgelegte Überkauf-Überverkaufsmarge gilt nicht für alle Sorten.
- Eine falsche Einstellung des Stop-Loss-Punktes kann zu größeren Verlusten führen.
- In den Trendmärkten kann es zu Verlusten kommen, wenn man zu viel Shorting macht.
Risikokontrollmaßnahmen umfassen: Optimierung der RSI-Parameter, Anpassung der Überkauf-Überverkauf-Trenchwerte an die verschiedenen Sorten, vernünftige Einstellung von Stop-Loss-Punkten, Vermeidung von Gegenhandel in Kombination mit Trendindikatoren.
Richtung der Strategieoptimierung
- Optimierung der RSI-Parameter zur Verbesserung der Genauigkeit bei Überkauf und Überverkauf
- In Kombination mit anderen Indikatoren bestätigen Handelssignale wie KDJ, MACD usw.
- Optimierung der Stop-Loss-Einstellungen entsprechend der Marktlage
- Trendschätzung erhöht und Rückwärtsoperationen vermieden
- Setzen Sie eine Gewinn- und Verlustkurve
- Entwicklung von Modulen zur Kontrolle von Einzel- und Gesamtrisiken
Zusammenfassen
Die Strategie ist eine automatische Handelsstrategie, die über den RSI-Indikator verwendet, um Überkauf und Überverkauf zu beurteilen. Sie sendet ein Handelssignal aus, wenn der RSI die überkaufte Überverkaufsextreme erreicht. Die Strategie ist einfach, klar und einfach umzusetzen und eignet sich als Basisstrategie für den automatischen Handel.
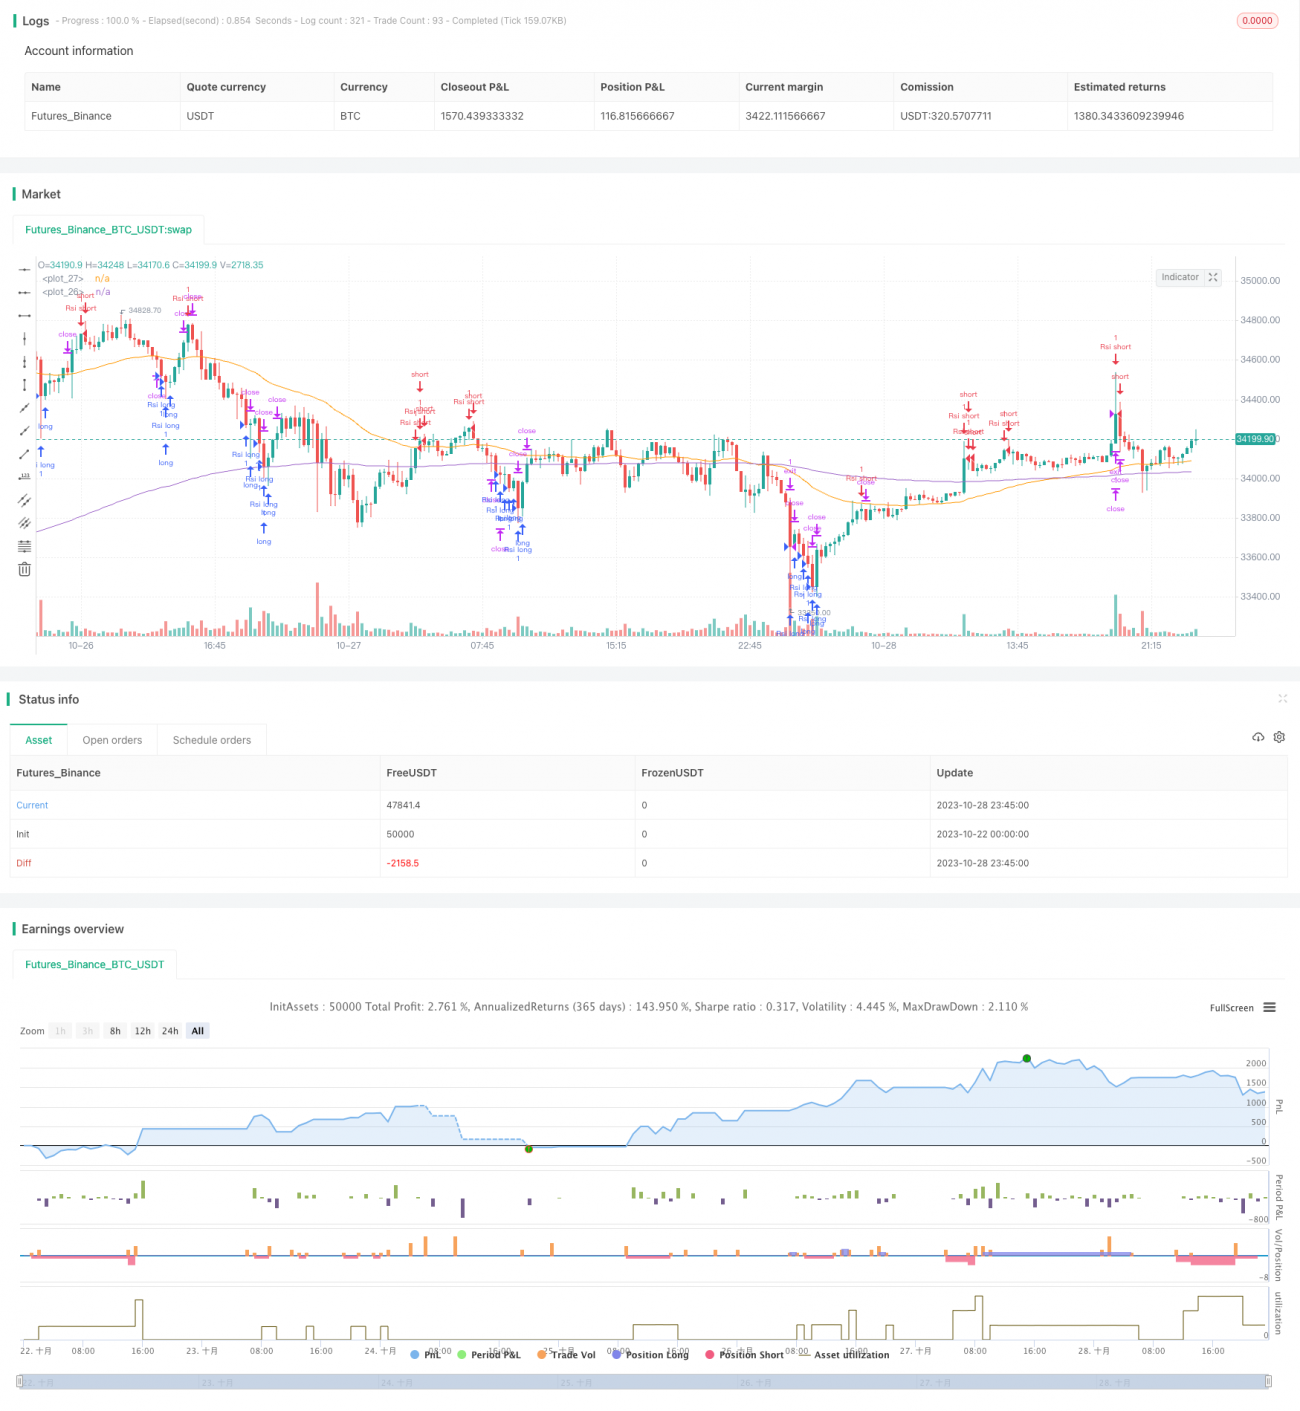
/*backtest
start: 2023-10-22 00:00:00
end: 2023-10-29 00:00:00
period: 15m
basePeriod: 5m
exchanges: [{"eid":"Futures_Binance","currency":"BTC_USDT"}]
*/

//@version=5
strategy("RSI Improved strategy", overlay=true)
higherTF1 = input.timeframe('15' , "Resolution", options = ['5', '15', '1H', 'D', 'W', 'M'])
dailyopen = request.security(syminfo.tickerid, higherTF1, close)- 1