Trendumkehrstrategie basierend auf Bollinger-Bändern

Überblick
Die Strategie basiert auf Bollinger Bands und Moving Averages, um zu beurteilen, ob die Preise nahe der Bollinger Bands nach unten sind, um eine LONG oder SHORT-Position einzugehen und so zu profitieren. Wenn die Preise die Bollinger Bands aufwärts brechen, ist es zu hoch; wenn die Preise die Bollinger Bands unterwärts brechen, ist es zu hoch. Es kombiniert die Vorteile der beiden Handelsstrategien Trendwende und Breakout, um bessere Gewinne zu erzielen, wenn der Trend schwankt.
Grundsätze
Die Strategie richtet sich vor allem an zwei Eintrittssignale:
-
Mehrkopfsignal: Wenn der Schlusskurs die Unterbahn berührt und der Schlusskurs über der EMA-Mittellinie liegt, ist der vorherige K-Linie-Wert negativ und der aktuelle K-Linie-Wert positiv.
-
Blank Signal: Wenn der Schlusskurs die Oberbahn berührt und der Schlusskurs unterhalb der EMA-Mittellinie liegt, ist die vorherige K-Line-Einheit die Sonnenlinie und die aktuelle K-Line-Einheit die Negation.
Stop-Loss-Methode: Fixed-Stop-Loss. Der Stop-Loss-Punkt ist ein Risiko-Return-Faktor, das das Risiko des Einstiegspreises auf die Entfernung des Gegners von der Straße um ein Vielfaches erhöht.
Stopp-Methode: Ziel ist es, den Gegner auf die Schiene zu bringen. Das heißt, mehr Stopps sind unter der Schiene und leere Stopps sind auf der Schiene.
Vorteile
-
Die Kombination von Vorteilen von Trend- und Umkehrungsstrategien kann bei Trendschwankungen besser funktionieren.
-
Der Bollinger Bands Index ist eine Methode, um Überkauf- und Überverkaufszonen zu ermitteln und die Chancen auf eine Umkehrung zu bestimmen.
-
Der Fixed Stop-Loss-Punkt ist vernünftiger und hilft bei der Risikokontrolle.
-
Das ist eine sehr gute Idee, um den Profit zu maximieren.
Die Gefahr
-
Die Strategie des Durchbruchs kann leicht arbitragiert werden.
-
Wenn die Situation zu unruhig ist, kann der Stop-Loss häufig ausgelöst werden.
-
Der Fixed Stop-Loss kann nicht an Marktbewegungen angepasst werden und kann zu locker oder zu radikal sein.
-
Wenn die Brin-Band-Parameter nicht richtig eingestellt sind, kann es zu schlechten Ergebnissen kommen.
Optimierung
-
Es kann in Betracht gezogen werden, ein eingehendes Signal mit einer Kombination von RSI-Indikatoren zu filtern, z. B. wenn der RSI höher als 50 ist, wird mehr getan, und wenn der RSI niedriger als 50 ist, wird weniger getan, um Fehlsignale zu vermeiden.
-
Hinzugefügt wurde die Funktion, die Feststop-Distanz automatisch anzupassen, um die Stop-Distanz flexibler zu machen. Zum Beispiel wird die Stop-Distanz dynamisch nach den ATR-Indikatoren eingestellt.
-
Optimierung der Bryn-Band-Parameter und Suche nach der optimalen Kombination der Parameter.
-
Verschiedene EMA-Gehaltsparameter können getestet werden, um den Schutzwall-Effekt der Gehaltslinie zu optimieren.
Zusammenfassen
Die Strategie berücksichtigt Trends und Umkehrungen, nutzt die Brin-Band, um Überkauf-Überverkaufsposten zu bestimmen, und maximiert die Gewinne durch mobile Stopps. Sie funktioniert besser bei Trendschwankungen. Sie muss jedoch darauf achten, dass Sie nicht eingehalten werden, und die Parameter müssen angepasst werden, um die Strategie zu optimieren.
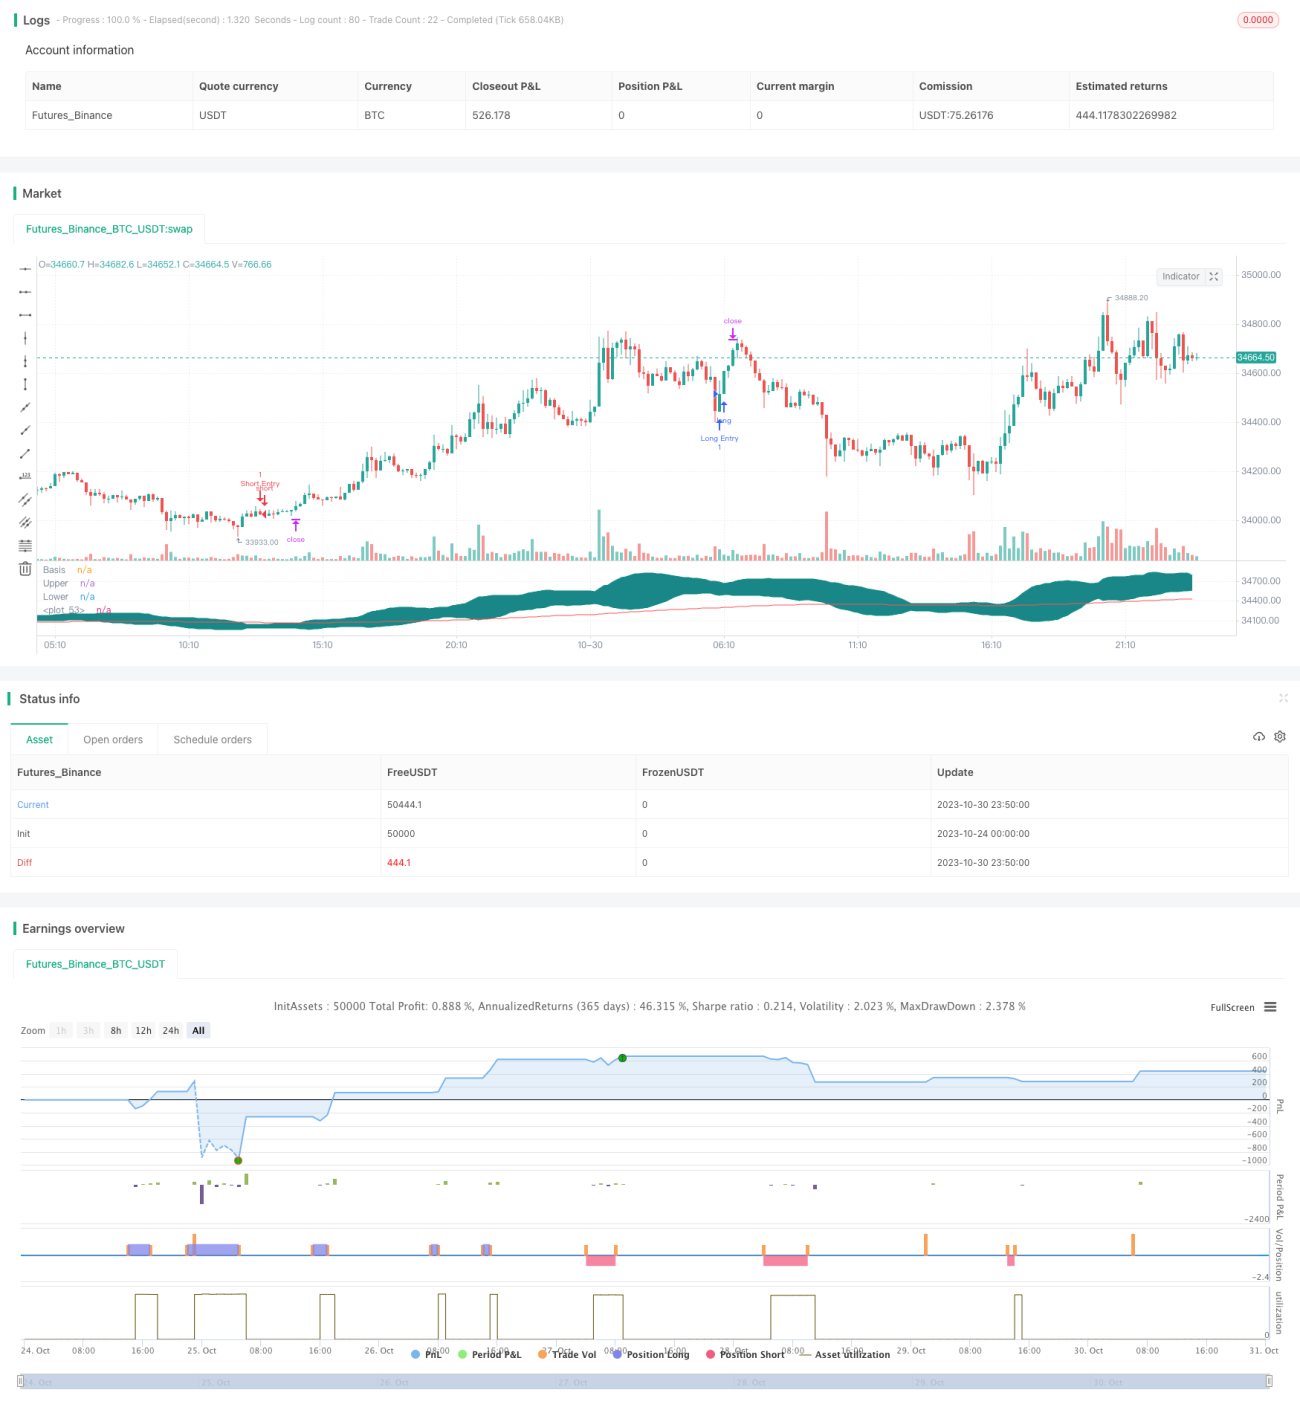
/*backtest
start: 2023-10-24 00:00:00
end: 2023-10-31 00:00:00
period: 10m
basePeriod: 1m
exchanges: [{"eid":"Futures_Binance","currency":"BTC_USDT"}]
*/

//@version=4

// Welcome to yet another script. This script was a lot easier since I was stuck for so long on the Donchian Channels one and learned so much from that one that I could use in this one
// This code should be a lot cleaner compared to the Donchian Channels, but we'll leave that up to the pro's- 1