Line-Trading-Strategie


Erstellungsdatum: 2023-11-02 14:14:34 zuletzt geändert: 2023-11-02 14:14:34
Kopie: 0 Klicks: 611
1
konzentrieren Sie sich auf
1617
Anhänger

Line-Trading-Strategie

Überblick

Die Strategie basiert auf der Idee, wichtige Unterstützungs- und Widerstandslinien zu durchbrechen, indem sie wichtige Aufwärts- und Abwärts-Trendlinien in den Preisdiagrammen identifiziert. Die Strategie ist einfach und zuverlässig und eignet sich für Marktumgebungen, in denen ein Trend eindeutig ist.

Strategieprinzip

Die Strategie identifiziert die wichtigsten Punkte für Preisanstiege und -rückgänge, indem sie die Höhen und Tiefen der linken und rechten Pylonlinien berechnet, um so Unterstützungs- und Drucklinien zu erhalten. Specifically:

  1. verwendenpivothigh()Undpivotlow()Funktionsdetektion der kritischen Höhen und Tiefen.

  2. Die Gleichungen für die Unterstützung und Drucklinien werden anhand der Höhen- und Tiefpunkte dargestellt.

  3. Wenn der Preis die Drucklinie überschreitet, machen Sie mehr; wenn der Preis die Unterstützungslinie überschreitet, machen Sie weniger.

  4. Die Auswahl zwischen Über- und Unterhalt basiert auf der Richtung der Trends.

  5. Sie können wählen, ob Sie bei einem Durchbruch direkt in die gleiche Position wechseln möchten.

  6. Optional können Stoppschaden, Stoppschaden und Schleppschaden verwendet werden.

  7. Swing-Punkt-Stopp, ATR-Stopp und Fixed-Stopp sind optional.

Die Strategie ist einfach und praktisch, um durch einfache Trendsignale den Handel zu durchbrechen, und kombiniert Trendverfolgung und Trendumkehr.

Analyse der Stärken

  • Die Strategie ist einfach, leicht zu verstehen und umzusetzen.
  • Die Nutzung von Breakthrough Theory hat einen gewissen Wahrscheinlichkeitsvorteil.
  • Ein Stop-Loss-Stopp kann eingestellt werden, um das Risiko zu kontrollieren.
  • Trend-Tracking oder Trend-Umkehr.
  • Optimierbare Parameter für verschiedene Marktumgebungen.

Risikoanalyse

  • Das Durchbruchsignal könnte falsch gemeldet worden sein.
  • Ein falscher Stop-Loss-Satz kann die Verluste erhöhen.
  • Es besteht die Gefahr, dass die Umkehroperation erwischt wird.
  • Parameter-Tuning erfordert Erfahrung und kann fehlerhaft sein.
  • Der Trend ist nur ein Durchbruch, nicht ein Erschütterungsschlag.

Das Risiko kann durch Optimierung der Stop-Loss-Strategie, Bewertung der Qualität des Durchbruchssignals und Bewertung der Umkehrzeit verringert werden.

Optimierungsrichtung

  • Die Reliabilität und Genauigkeit der Durchbruchsignale werden bewertet.
  • In Kombination mit Volume verstärkt das Signal für den Durchbruch.
  • Optimierung von Stop-Loss-Strategien und Anpassung an Marktschwankungen.
  • Bewerten Sie die optimale Umkehrzeit.
  • parameter tuning。
  • Beurteilung des Multifaktormodells
  • Bewertung in Verbindung mit anderen Indikatoren.

Zusammenfassen

Die Strategie ist insgesamt einfach und praktisch, um die Preisentwicklung durch einfache Trendbrechungen zu erfassen. Die Strategie kann in vielerlei Hinsicht optimiert werden und für mehrere Marktbedingungen verwendet werden. Insgesamt ist es eine sehr praktische Trendverfolgung.
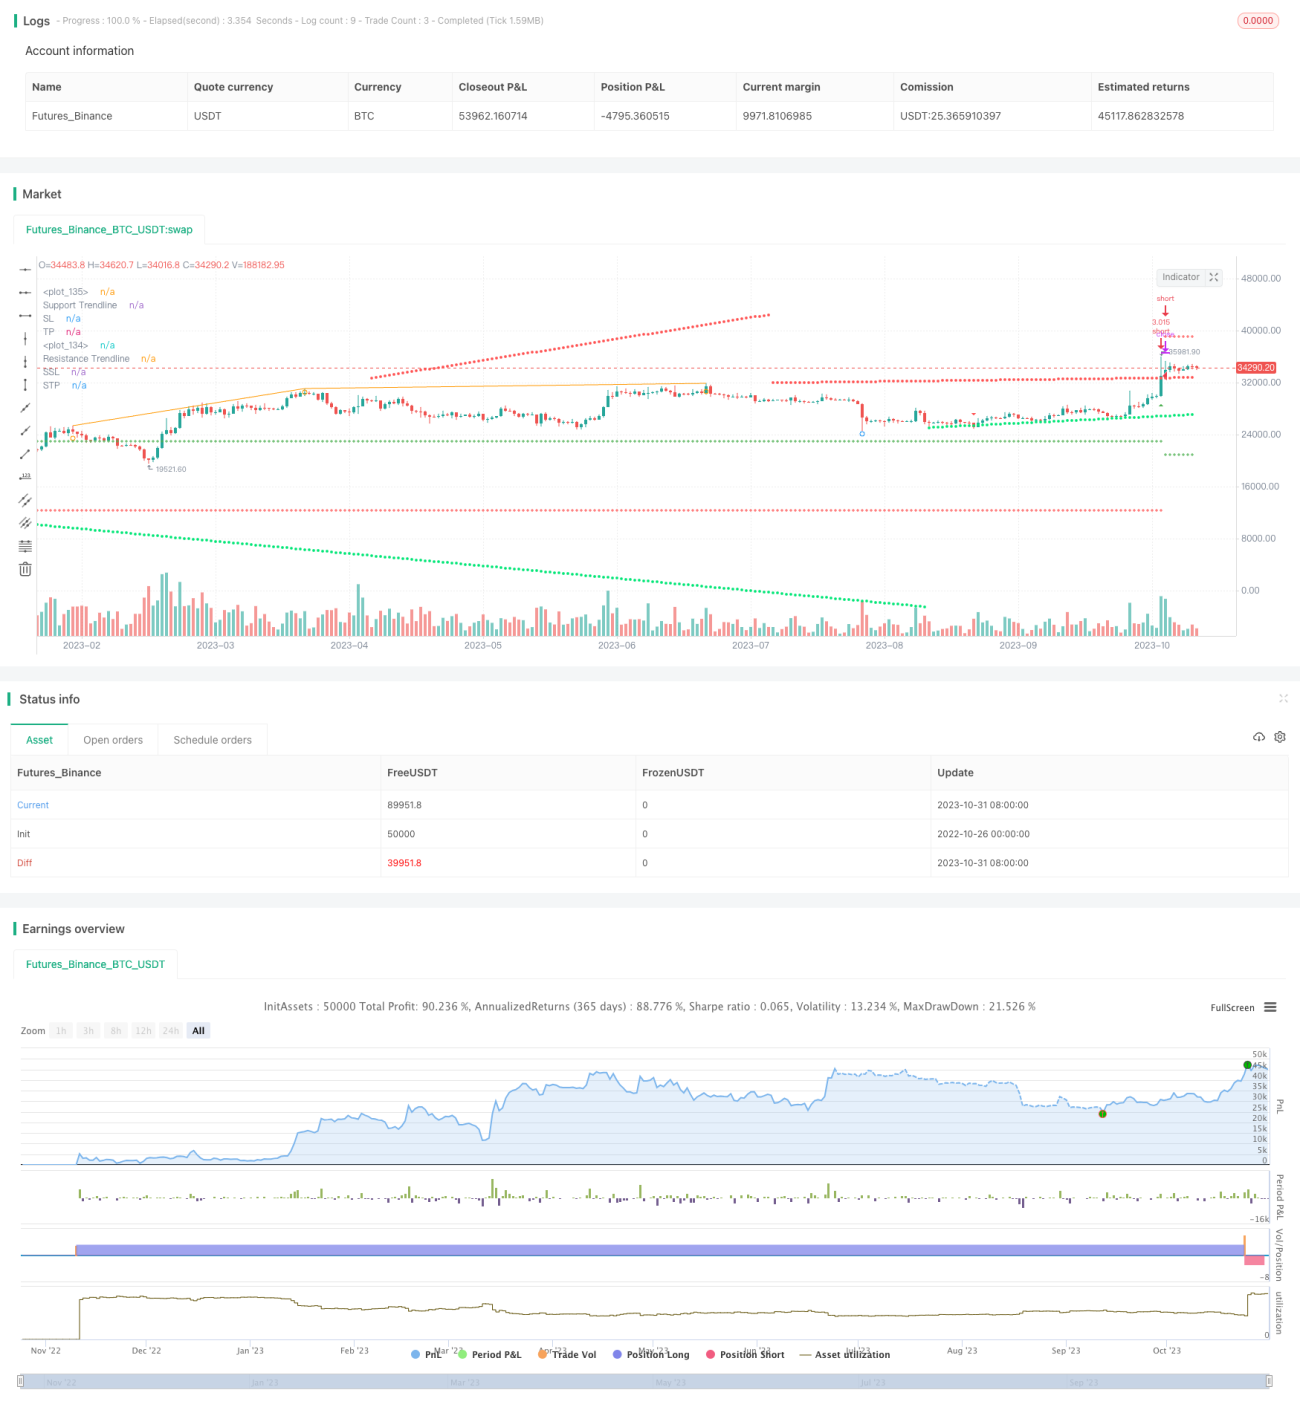
Strategiequellcode
/*backtest
start: 2022-10-26 00:00:00
end: 2023-11-01 00:00:00
period: 1d
basePeriod: 1h
exchanges: [{"eid":"Futures_Binance","currency":"BTC_USDT"}]
*/

// This source code is subject to the terms of the Mozilla Public License 2.0 at https://mozilla.org/MPL/2.0/
// © tweakerID and © BacktestRookies

// Using the clever calculations and code by BacktestRookies, here is a strategy that buys 
// when the price breaks above a trendline and sells (or shorts) when it crosses below. 
// This logic can be reversed, which seems to work better with recent market conditions.

//@version=4
strategy("Trendlines Strategy", 
     overlay=true, 
     default_qty_type=strategy.percent_of_equity, 
     default_qty_value=100, 
     initial_capital=10000, 
     commission_value=0.04, 
     calc_on_every_tick=false, 
     slippage=0)

direction = input(0, title = "Strategy Direction", type=input.integer, minval=-1, maxval=1)
strategy.risk.allow_entry_in(direction == 0 ? strategy.direction.all : 
 (direction < 0 ? strategy.direction.short : strategy.direction.long))

// Bought and Sold Boolean Signal
bought = strategy.position_size > strategy.position_size[1] 
 or strategy.position_size < strategy.position_size[1]

/////////////////////// STRATEGY INPUTS ////////////////////////////////////////
title1=input(true, "-----------------Strategy Inputs-------------------")  

leftbars = input(100, minval=1, title='Pivot Detection: Left Bars')
rightbars = input(15, minval=1, title='Pivot Detection: Right Bars')
plotpivots = input(true, title='Plot Pivots')

/////////////////////// BACKTESTER /////////////////////////////////////////////
title2=input(true, "-----------------General Inputs-------------------")  

// Backtester General Inputs
i_SL=input(true, title="Use Stop Loss and Take Profit")
TS=input(false, title="Use Trailing Stop")
i_SLType=input(defval="ATR Stop", title="Type Of Stop", options=["Strategy Stop", "Swing Lo/Hi", "ATR Stop"])
i_SPL=input(defval=10, title="Swing Point Lookback")
i_PercIncrement=input(defval=3, step=.1, title="Swing Point SL Perc Increment")*0.01
i_ATR = input(14, title="ATR Length")
i_ATRMult = input(4, step=.1, title="ATR Multiple")
i_TPRRR = input(2, step=.1, title="Take Profit Risk Reward Ratio")
DPR=input(true, "Allow Direct Position Reverse")
reverse=input(true, "Reverse Trades")

// Swing Points Stop and Take Profit
SwingStopProfit() =>
    LL=(lowest(i_SPL))*(1-i_PercIncrement)
    HH=(highest(i_SPL))*(1+i_PercIncrement)
    LL_price = valuewhen(bought, LL, 0)
    HH_price = valuewhen(bought, HH, 0)
    entry_LL_price = strategy.position_size > 0 ? LL_price : na 
    entry_HH_price = strategy.position_size < 0 ? HH_price : na 
    tp=strategy.position_avg_price + (strategy.position_avg_price - entry_LL_price)*i_TPRRR
    stp=strategy.position_avg_price - (entry_HH_price - strategy.position_avg_price)*i_TPRRR
    [entry_LL_price, entry_HH_price, tp, stp]

// ATR Stop
ATRStop() =>
    ATR=atr(i_ATR)*i_ATRMult
    ATRLong = ohlc4 - ATR
    ATRShort = ohlc4 + ATR
    ATRLongStop = valuewhen(bought, ATRLong, 0)
    ATRShortStop = valuewhen(bought, ATRShort, 0)
    LongSL_ATR_price = strategy.position_size > 0 ? ATRLongStop : na 
    ShortSL_ATR_price = strategy.position_size < 0 ? ATRShortStop : na 
    ATRtp=strategy.position_avg_price + (strategy.position_avg_price - LongSL_ATR_price)*i_TPRRR
    ATRstp=strategy.position_avg_price - (ShortSL_ATR_price - strategy.position_avg_price)*i_TPRRR
    [LongSL_ATR_price, ShortSL_ATR_price, ATRtp, ATRstp]
    
// Strategy Stop
StrategyStop(bought) =>
    float LongStop = na
    float ShortStop = na
    float StratTP = na
    float StratSTP = na
    [LongStop, ShortStop, StratTP, StratSTP]

//TrailingStop
TrailingStop(SL,SSL) =>
    dif=(valuewhen(strategy.position_size>0 and strategy.position_size[1]<=0, high,0))
     -strategy.position_avg_price
    trailOffset     = strategy.position_avg_price - SL
    var tstop = float(na)
    if strategy.position_size > 0
        tstop := high- trailOffset - dif
        if tstop<tstop[1]
            tstop:=tstop[1]
    else
        tstop := na
    StrailOffset     = SSL - strategy.position_avg_price
    var Ststop = float(na)
    Sdif=strategy.position_avg_price-(valuewhen(strategy.position_size<0 
     and strategy.position_size[1]>=0, low,0))
    if strategy.position_size < 0
        Ststop := low+ StrailOffset + Sdif
        if Ststop>Ststop[1]
            Ststop:=Ststop[1]
    else
        Ststop := na
    [tstop, Ststop]
  
//Stop Loss & Take Profit Switches  
SLTPLogic(LongStop, ShortStop, StratTP, StratSTP, LongSL_ATR_price, ShortSL_ATR_price, ATRtp, ATRstp,
 entry_LL_price, entry_HH_price, tp, stp) =>
    SL= i_SLType == "Swing Lo/Hi" ? entry_LL_price : i_SLType == "ATR Stop" ? LongSL_ATR_price : LongStop
    SSL= i_SLType == "Swing Lo/Hi" ? entry_HH_price : i_SLType == "ATR Stop" ? ShortSL_ATR_price : ShortStop
    TP= i_SLType == "Swing Lo/Hi" ? tp : i_SLType == "ATR Stop" ? ATRtp : StratTP
    STP= i_SLType == "Swing Lo/Hi" ? stp : i_SLType == "ATR Stop" ? ATRstp : StratSTP
    [SL, SSL, TP, STP]


/////////////////////// STRATEGY LOGIC /////////////////////////////////////////

// Pivots
ph = pivothigh(high, leftbars, rightbars)
pl = pivotlow(low, leftbars, rightbars)

phv1 = valuewhen(ph, high[rightbars], 0)
phb1 = valuewhen(ph, bar_index[rightbars], 0)
phv2 = valuewhen(ph, high[rightbars], 1)
phb2 = valuewhen(ph, bar_index[rightbars], 1)

plv1 = valuewhen(pl, low[rightbars], 0)
plb1 = valuewhen(pl, bar_index[rightbars], 0)
plv2 = valuewhen(pl, low[rightbars], 1)
plb2 = valuewhen(pl, bar_index[rightbars], 1)
    
plotshape(ph, style=shape.circle, location=location.abovebar, color=color.orange,  title='Pivot High', offset=-rightbars)
plotshape(pl, style=shape.circle,   location=location.belowbar, color=color.blue, title='Pivot Low',  offset=-rightbars)

plot(ph ? high[rightbars] : na, color=color.orange, offset=-rightbars)
plot(pl ? low[rightbars] : na, color=color.purple, offset=-rightbars)

// TRENDLINE CODE
// --------------
get_slope(x1,x2,y1,y2)=>
    m = (y2-y1)/(x2-x1)
 
get_y_intercept(m, x1, y1)=>
    b=y1-m*x1

get_y(m, b, ts)=>
    Y = m * ts + b


int   res_x1 = na
float res_y1 = na
int   res_x2 = na
float res_y2 = na

int   sup_x1 = na
float sup_y1 = na
int   sup_x2 = na
float sup_y2 = na


// Resistance
res_x1 := ph ? phb1 : res_x1[1]
res_y1 := ph ? phv1 : res_y1[1]
res_x2 := ph ? phb2 : res_x2[1]
res_y2 := ph ? phv2 : res_y2[1]

res_m = get_slope(res_x1,res_x2,res_y1,res_y2)
res_b = get_y_intercept(res_m, res_x1, res_y1)
res_y = get_y(res_m, res_b, bar_index)

// Support
sup_x1 := pl ? plb1 : sup_x1[1]
sup_y1 := pl ? plv1 : sup_y1[1]
sup_x2 := pl ? plb2 : sup_x2[1]
sup_y2 := pl ? plv2 : sup_y2[1]

sup_m = get_slope(sup_x1,sup_x2,sup_y1,sup_y2)
sup_b = get_y_intercept(sup_m, sup_x1, sup_y1)
sup_y = get_y(sup_m, sup_b, bar_index)


// plot(line.get_y2(line1))
plot(res_y, color=color.red, title='Resistance Trendline', linewidth=2, style=plot.style_circles)
plot(sup_y, color=color.lime, title='Support Trendline', linewidth=2, style=plot.style_circles)

// if ph
//     line.new(phb1,phv1, bar_index, res_y, style=line.style_dashed, color=color.blue)
    
// if pl
//     line.new(plb1,plv1, bar_index, sup_y, style=line.style_dashed, color=color.blue)
    
// Breaks
long_break = crossover(close, res_y)
short_break = crossunder(close, sup_y)
plotshape(long_break,  style=shape.triangleup, color=color.green, size=size.tiny, location=location.belowbar, title='Long Break')
plotshape(short_break, style=shape.triangledown, color=color.red, size=size.tiny, location=location.abovebar, title='Short Break')

BUY=long_break
SELL=short_break

/////////////////////// FUNCTION CALLS /////////////////////////////////////////

// Stops and Profits
[entry_LL_price, entry_HH_price, tp, stp] = SwingStopProfit()
[LongSL_ATR_price, ShortSL_ATR_price, ATRtp, ATRstp] = ATRStop()
[LongStop, ShortStop, StratTP, StratSTP] = StrategyStop(bought)
[SL, SSL, TP, STP] = SLTPLogic(LongStop, ShortStop, StratTP, StratSTP, 
 LongSL_ATR_price, ShortSL_ATR_price, ATRtp, ATRstp, entry_LL_price, entry_HH_price, tp, stp)
[tstop, Ststop] = TrailingStop(SL,SSL)

// Entries
if reverse
    if not DPR
        strategy.entry("long", strategy.long, when=SELL and strategy.position_size == 0)
        strategy.entry("short", strategy.short, when=BUY and strategy.position_size == 0)
    else     
        strategy.entry("long", strategy.long, when=SELL)
        strategy.entry("short", strategy.short, when=BUY)
else
    if not DPR 
        strategy.entry("long", strategy.long, when=BUY and strategy.position_size == 0)
        strategy.entry("short", strategy.short, when=SELL and strategy.position_size == 0)
    else
        strategy.entry("long", strategy.long, when=BUY)
        strategy.entry("short", strategy.short, when=SELL)
// Exits
if i_SL
    strategy.exit("TP & SL", "long", limit=TP, stop=TS? tstop : SL)
    strategy.exit("TP & SL", "short", limit=STP, stop=TS? Ststop : SSL)

/////////////////////// PLOTS //////////////////////////////////////////////////

plot(i_SL and strategy.position_size > 0 and not TS ? SL : i_SL and 
 strategy.position_size > 0 and TS ? tstop : na , title='SL', style=plot.style_cross, color=color.red)
plot(i_SL and strategy.position_size < 0 and not TS ? SSL : i_SL and 
 strategy.position_size < 0 and TS ? Ststop : na , title='SSL', style=plot.style_cross, color=color.red)
plot(i_SL and strategy.position_size > 0 ? TP : na, title='TP', style=plot.style_cross, color=color.green)
plot(i_SL and strategy.position_size < 0 ? STP : na, title='STP', style=plot.style_cross, color=color.green)

// Draw price action setup arrows
plotshape(BUY ? 1 : na, style=shape.triangleup, location=location.belowbar, 
 color=color.green, title="Bullish Setup", size=size.auto)
plotshape(SELL ? 1 : na, style=shape.triangledown, location=location.abovebar, 
 color=color.red, title="Bearish Setup", size=size.auto)