Bidirektionale Handelsstrategie basierend auf RSI und SuperTrend
Überblick
Es handelt sich um eine Zwei-Wege-Trading-Strategie, die die RSI- und SuperTrend-Indikatoren kombiniert. Die Strategie zielt darauf ab, die starken Schwächen des Marktes zu identifizieren und bei Trendwechsel in der richtigen Zeit zu wechseln, um höhere Gewinne zu erzielen.
Strategieprinzip
Die Strategie basiert auf folgenden Prinzipien:
Der RSI-Indikator wird verwendet, um die Stärken und Schwächen des aktuellen Marktes zu beurteilen. Wenn der RSI über 50 liegt, ist es ein starker Markt, wenn er unter 50 liegt, ist es ein schwacher Markt.
Der SuperTrend-Indikator dient als Trendfilter. Der Signal wird nur ausgesendet, wenn der Preis den SuperTrend überschreitet.
Wenn der RSI ein starkes Signal sendet, machen Sie mehr, wenn der Preis die Oberbahn überschreitet; wenn der Preis die Unterbahn überschreitet, platzieren Sie.
Wenn der RSI-Indikator ein Signal der Schwäche sendet, wird der Kurs gekündigt, wenn der Kurs die Unterbahn durchbricht; wenn der Preis die Oberbahn durchbricht, wird die Position platziert.
Um Trendwechselpunkte zu erfassen, wird der RSI-Indikator mit einer Multi-Bohr-Umstellung umgestellt.
Umsetzung
Der RSI wird mit einer Länge von 14 berechnet, wobei 50 als Grenze gilt.
Berechnen Sie den SuperTrend-Indikator mit einer Länge von 10 und einer Größe von 2.
Wenn der RSI über 50 liegt und der Preis den SuperTrend überschreitet, machen Sie mehr. Wenn der RSI unter 50 liegt und der Preis den SuperTrend überschreitet, machen Sie weniger.
Wenn der RSI schwächer wird und der Preis den SuperTrend überschreitet, wird der Kurs platziert. Wenn der RSI stärker wird und der Preis den SuperTrend überschreitet, wird der Kurs platziert.
Sie können nur mehr oder nur weniger tun.
Strategische Vorteile
Diese Strategie kombiniert Trend-Tracking und Überkauf-Überverkauf-Urteile und hat folgende Vorteile:
Es ist wichtig zu wissen, dass es sich um eine sehr gute Strategie handelt, um Trends zu erfassen, um unnötige Risiken zu reduzieren.
Der RSI ist ein guter Indikator, um überkaufte und überverkaufte Bereiche zu erkennen, um zu vermeiden, dass der Markt vor der Umkehrung nach oben oder unten jagt.
SuperTrend filtert besser den Lärm des Marktes und folgt den mittleren und langen Trends.
Die Kombination von RSI und SuperTrend erhöht die Stabilität der Strategie.
Die Optimierung der Parameter dieser Strategie ist groß und kann je nach Sorte und Periode angepasst werden.
Unterstützt wird das Modul “nur mehr” oder “nur leere Arbeit” mit der Möglichkeit, flexibel auf verschiedene Situationen zu reagieren.
Strategisches Risiko
Es gibt einige Risiken bei dieser Strategie:
Der RSI-Indikator kann leicht zu falschen Signalen führen, was in Verbindung mit der tatsächlichen Bestätigung des Preises erforderlich ist.
Die falsche Einstellung der Parameter des SuperTrend-Indikators kann zu einem Ausfall führen oder zu einem Auf- und Absturz führen.
Bei doppelten Indikatoren besteht die Gefahr einer Streuung, die Parameter müssen an die optimale Übereinstimmung angepasst werden.
Wenn sich die Situation dramatisch verändert, kann der Stop-Loss ausgeschaltet werden, so dass eine vernünftige Einstellung der Stop-Loss-Position erforderlich ist.
Es ist zu vermeiden, umgekehrt in der Nähe von wichtigen Resistenz- und Unterstützungsgebieten zu lagern.
Strategieoptimierung
Diese Strategie kann auch in folgenden Bereichen optimiert werden:
Anpassung der RSI-Parameter zur Suche nach der optimalen Länge, um falsche Signale zu filtern.
Optimierung der SuperTrend-Parameter zur Verbesserung der Trendverfolgung.
Verschiedene Sorten mit unterschiedlichen Parameterkombinationen für verschiedene Zyklen zu testen, um die optimale Parameter zu finden.
Zusätzliche Filter für andere Indikatoren, wie MACD, KDJ, etc., verbessern die Signalgenauigkeit.
Hinzu kommen entscheidende Unterstützungswiderstände, Brinline, Bewegungsabschnitte und andere entscheidende, qualitative Strategie-Signale.
Optimierung der Stop-Loss-Strategie, um die Wahrscheinlichkeit, dass die Stop-Loss-Systeme ausgeschaltet werden, so gering wie möglich zu halten, sofern die Effektivität der Stop-Loss-Strategie gewährleistet ist.
Zusammenfassen
Die Strategie integriert die Vorteile der beiden Indikatoren RSI und SuperTrend, um die Veränderungen der mittelfristigen Markttrends effektiv zu erkennen und zwischen den Bären- und Bullenmärkten zu wechseln. Durch die Optimierung der Parameter kann sie sich an eine breitere Palette von Marktbedingungen anpassen. Allerdings müssen einige häufige Probleme wie Falschsignale, ParameterSet usw. beachtet werden.
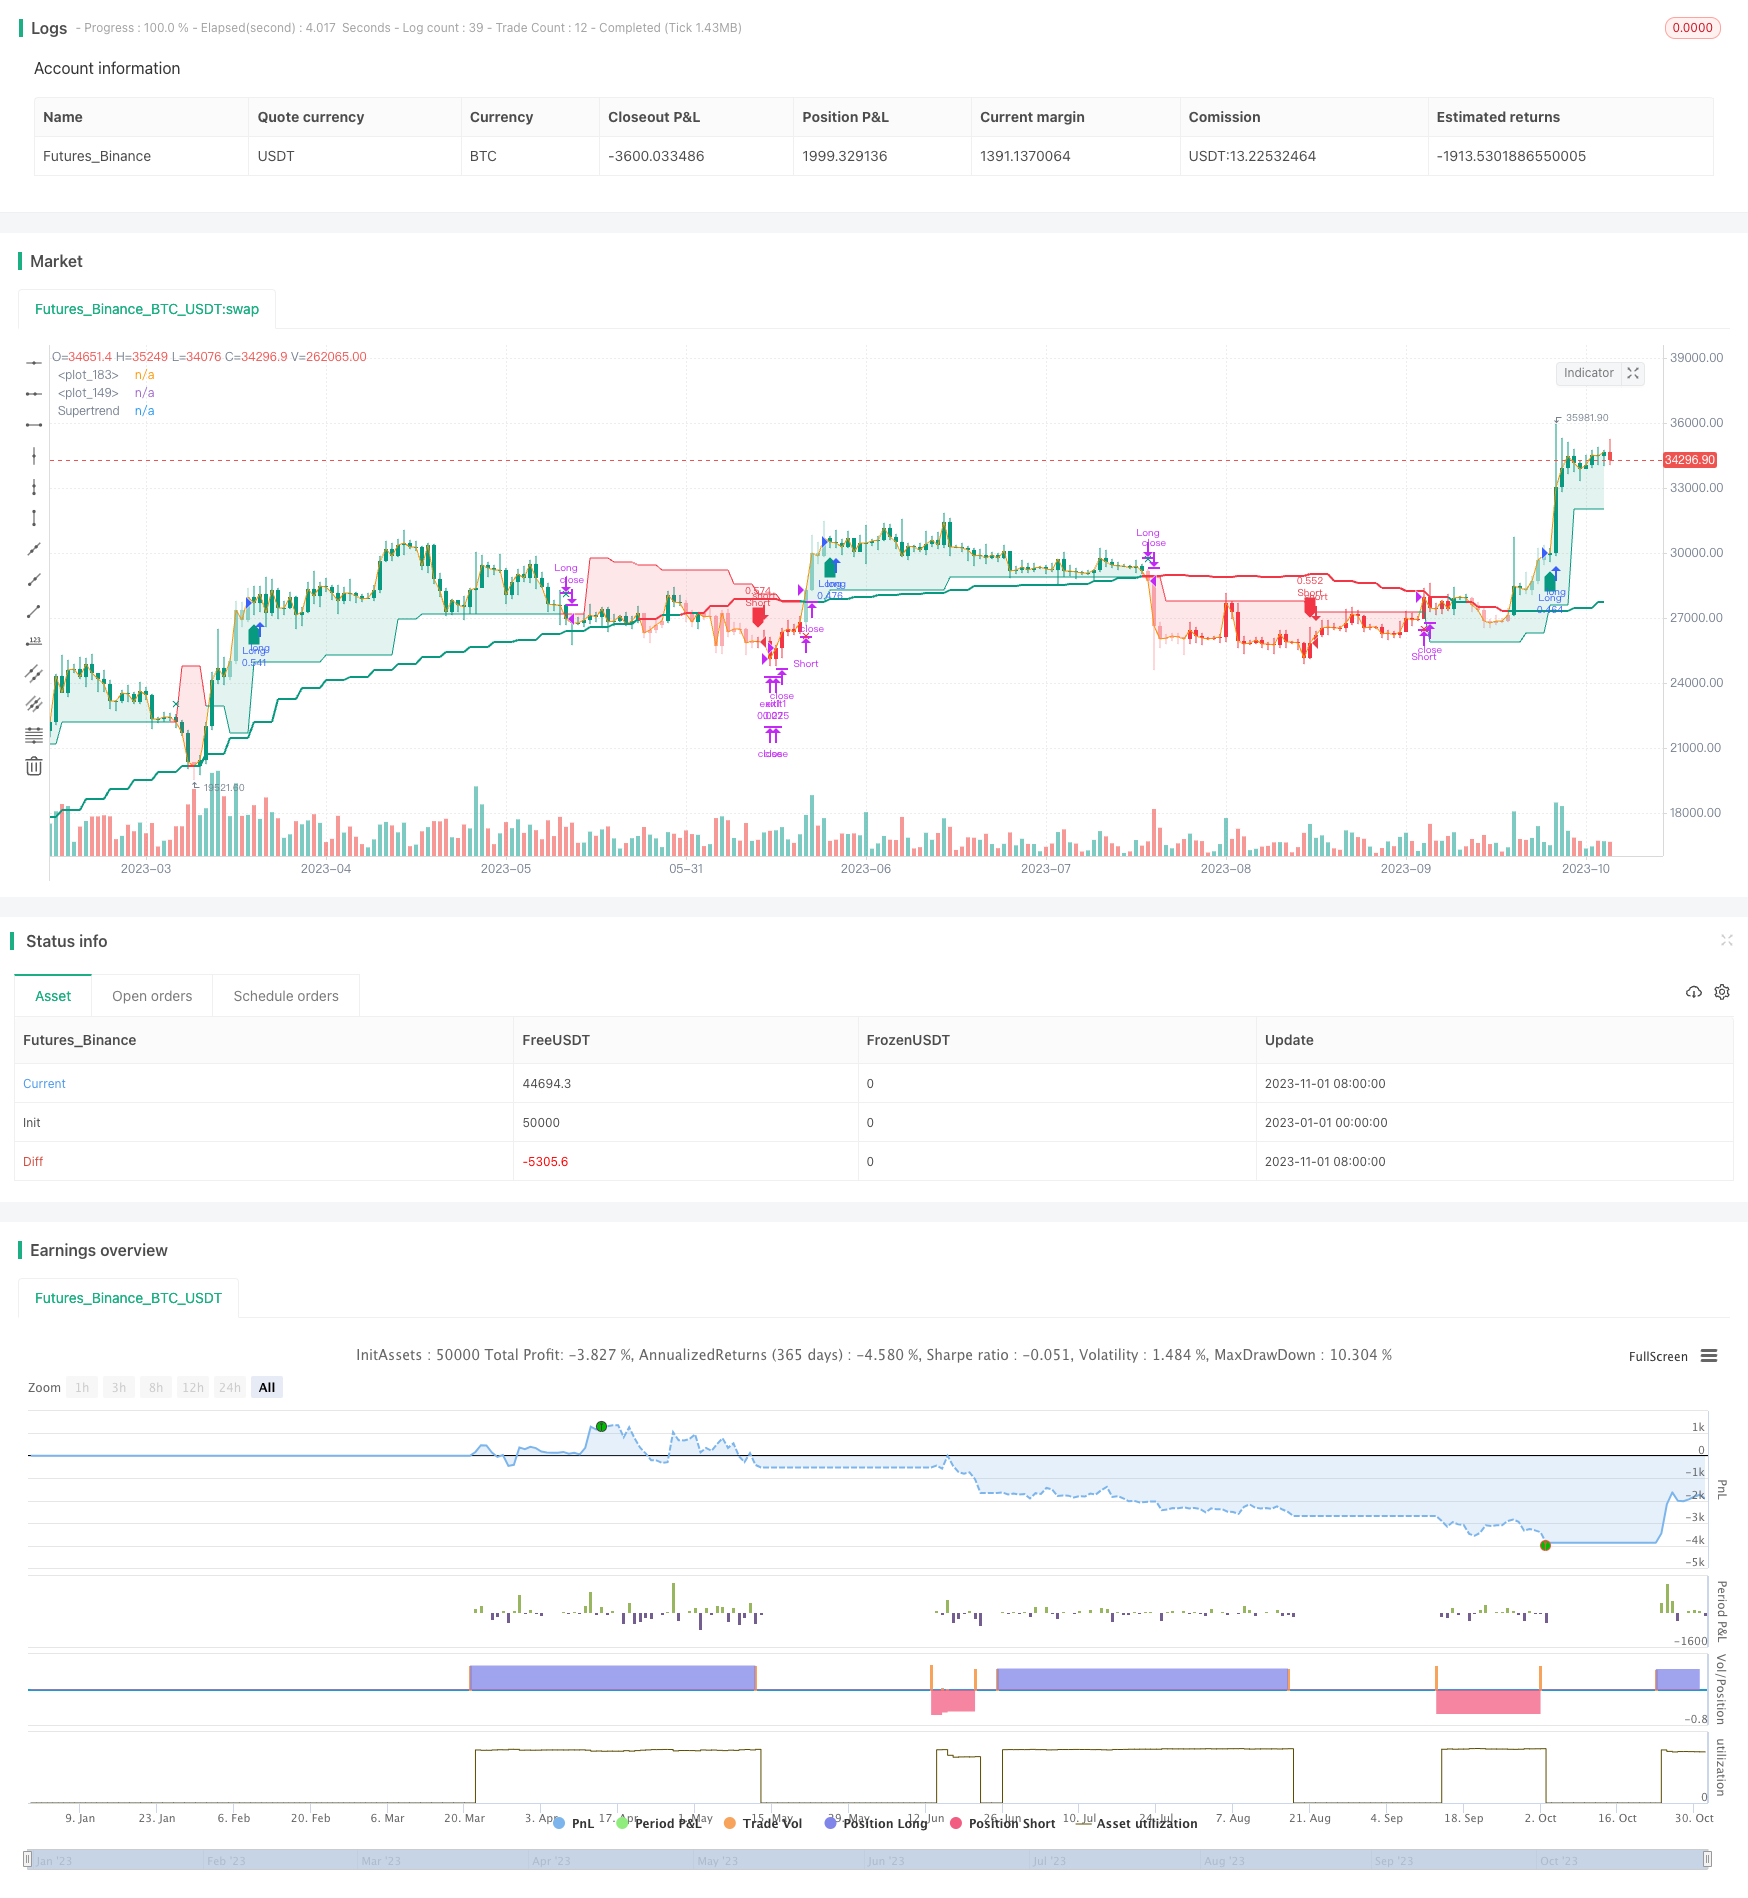
/*backtest
start: 2023-01-01 00:00:00
end: 2023-11-02 00:00:00
period: 1d
basePeriod: 1h
exchanges: [{"eid":"Futures_Binance","currency":"BTC_USDT"}]
*/

// This source code is subject to the terms of the Mozilla Public License 2.0 at https://mozilla.org/MPL/2.0/
//@version=5
//Created by @CITIAlgo
// —————————————————————————————————————————————————————————————————————————————————————————————————————————

strategy('CITI Trends A with RSI Candles', shorttitle = "CITI Trends A" , overlay = true ,
         initial_capital   = 10000,
         commission_value  = 0.025,
         default_qty_value = 25,
         slippage          = 1,
         pyramiding        = 0,
         max_lines_count   = 500,
         max_labels_count  = 500,
         currency          = currency.USD,
         default_qty_type  = strategy.percent_of_equity)

bullColor1 =  #089981
bearColor1 =  #f23645
bullColor2 =  #3873e3
bearColor2 =  #630ef5
neutralColor1 = #d5d5d5

//Base Settings
groupBase = "Base Settings ---------------------------------------"
Repaint_type = input.string('Non-Repainting', "Allow Repainting ?", options = ['Non-Repainting', 'Repainting'], inline ='repaint' , group = groupBase , tooltip = 'The default value is Non-Repainting. To learn more visit https://www.tradingview.com/pine-script-docs/en/v5/concepts/Repainting.html')

//Configure trade direction
tradeDirection = input.string("Both", title="Trade Direction", options=["Long", "Short", "Both"] , group=groupBase , inline = 'Type' )

longOK  = tradeDirection == "Long" or tradeDirection == "Both"
shortOK = tradeDirection == "Short" or tradeDirection == "Both"

var bool PlotEntries = input.bool (true, "Show Entries" ,group=groupBase , inline = 'Signals' )
var bool PlotExits = input.bool (true, "Show Exits" , group=groupBase, inline = 'Signals' )

//Display Settings
groupDisplay = "Display Settings ------------------------------------"

MomBars = input.bool( true , title="Apply Bar Colors", inline = 'candles' , group=groupDisplay)

cbullColor = input.color( bullColor1  , 'Candle Colors' ,  inline = 'candles1a',group=groupDisplay)
cbearColor =  input.color( bearColor1  , '' ,  inline = 'candles1a',group=groupDisplay)

//Candle & label Colors
Bullish_Bars    = color.new( cbullColor , 0)
WBullish_Bars   = color.new( cbullColor , 60)
Bearish_Bars    = color.new( cbearColor , 0)
WBearish_Bars   = color.new( cbearColor , 60)

lbullColor = input.color( bullColor1  , 'Long/Short Labels' ,  group=groupDisplay, inline = 'Signals1' )
lbearColor =  input.color( bearColor1 , ''  , group=groupDisplay, inline = 'Signals1' )

st_status = input.bool( true , title="Show Supertrend", inline = 'st' , group=groupDisplay)
st_bullColor = input.color( bullColor1  , '' ,  group=groupDisplay, inline = 'st' )
st_bearColor =  input.color( bearColor1 , ''  , group=groupDisplay, inline = 'st' )

//Build Your Signals Settings
groupEntry = " Trend & Signal Settings---------------------"
Entry1a = input.bool(true, title= "Entry", inline='entry1a', group=groupEntry)
Exit1a  = input.bool(false, title= "Exit | Strong/Weak Momentum", inline='entry1a', group=groupEntry)
Entry1b = input.bool(false,  title=  'Entry'  , inline='entry1b', group=groupEntry)
Exit1b  = input.bool(false, title= 'Exit | Bull/Bear Momentum'  , inline='entry1b', group=groupEntry)

Entry3a = input.bool(false, title= "Filter", inline='entry3a', group=groupEntry)
Exit3a  = input.bool(false, title= "Exit | MA ", inline='entry3a', group=groupEntry)

Entry4a = input.bool(false, title= "Filter | Disable RSI Ranges ", inline='entry4a', group=groupEntry)
Entry4b = input.bool(true, title= "Filter", inline='entry4b', group=groupEntry)
Exit4b  = input.bool(true, title= "Exit | Supertrend ", inline='entry4b', group=groupEntry)
Entry4c = input.bool(true, title= "Filter | Disable Supertrend Ranges ", inline='entry4c', group=groupEntry)
// —————————————————————————————————————MTF FUNCTIONS
// —————————— PineCoders MTF Selection Framework functions
// ————— Converts current "timeframe.multiplier" plus the TF into minutes of type float.
f_resInMinutes() =>
    _resInMinutes = timeframe.multiplier * (timeframe.isseconds ? 1. / 60. : timeframe.isminutes ? 1. : timeframe.isdaily ? 1440. : timeframe.isweekly ? 10080. : timeframe.ismonthly ? 43800. : na)
    _resInMinutes

// Get current resolution in float minutes.
var ResInMinutes = f_resInMinutes()

// ————— Returns resolution of _resolution period in minutes.
f_tfResInMinutes(_res) =>
    // _res: resolution of any TF (in "timeframe.period" string format).
    request.security(syminfo.tickerid, _res, f_resInMinutes())

// ————— Returns a multiple of current resolution as a string in "timeframe.period" format usable with "security()".
f_multipleOfRes(_res, _mult) =>
    // _res:  current resolution in minutes, in the fractional format supplied by f_resInMinutes() companion function.
    // _mult: Multiple of current TF to be calculated.
    // Convert current float TF in minutes to target string TF in "timeframe.period" format.
    _targetResInMin = _res * math.max(_mult, 1)
    // Find best string to express the resolution.
    _targetResInMin <= 0.083 ? '5S' : _targetResInMin <= 0.251 ? '15S' : _targetResInMin <= 0.501 ? '30S' : _targetResInMin <= 1440 ? str.tostring(math.round(_targetResInMin)) : _targetResInMin <= 43800 ? str.tostring(math.round(math.min(_targetResInMin / 1440, 365))) + 'D' : str.tostring(math.round(math.min(_targetResInMin / 43800, 12))) + 'M'

// ————— Converts current resolution
f_resInString(_res) =>
    // _res: resolution of any TF (in "timeframe.period" string format).
      _res  == "1"   ? "1m"  :
      _res  == "3"   ? "3m"  :
      _res  == "5"   ? "5m"  :
      _res  == "15"  ? "15m" :
      _res  == "30"  ? "30m" :
      _res  == "45"  ? "45m" :
      _res  == "60"  ? "1h"  :
      _res  == "120" ? "2h"  :
      _res  == "180" ? "3h"  :
      _res  == "240" ? "4h"  :
      _res  == "1D"  ? "D"   :
      _res  == "1W"  ? "W"   :
      _res  == "1M"  ? "M"   : _res

//Set repaint security function
repaint_sw = Repaint_type == 'Non-Repainting' ? false : true
f_security(_symbol, _res, _src, _repaint) => request.security(_symbol, _res, _src[_repaint ? 0 : barstate.isrealtime ? 1 : 0] , barmerge.gaps_off, barmerge.lookahead_on)[_repaint ? 0 : barstate.isrealtime ? 0 : 1]
f_source(_res , source) => f_security(syminfo.tickerid , _res , source , repaint_sw )

Type1 = 'Auto Multiplied TF'
Type2 = 'Fixed TF'
//---------------------------------------------------------------------------
//RSI Settings // INPUTS
groupRange   = "RSI Settings  ----------------------------------"

TF1type = input.string( Type1, 'TF' ,  options=[Type1,Type2] , inline ='tf1' , group=groupRange)
setHTF1a = input.int( 4 , '' , inline ='tf1', group=groupRange)
setHTF1b = input.timeframe( 'D' , '' , inline ='tf1', group=groupRange)
// Get HTF from user-defined mode.
var TF1 = TF1type == Type1 ? f_multipleOfRes(ResInMinutes, setHTF1a) : setHTF1b

mLength    =  input.int( 14  ,  "RSI Length"  ,inline='lines', group=groupRange)
BullLevel  = input.int( 50 ,  "Bullish Level | Above 50       ",inline='lines1a', group=groupRange)
BearLevel  = input.int( 50 , "Bearish Level | Below 50        ",inline='lines1b', group=groupRange)

ma_length  = input.int( 21  ,  "MA Length"  ,inline='ma', group=groupRange)
ma_status  = input.bool( true ,  "Show MA" ,inline='ma1', group=groupRange)
ma_bullColor = input.color( bullColor1  , '' ,  inline='ma1', group=groupRange)
ma_bearColor =  input.color( bearColor1 , ''  , inline='ma1', group=groupRange)
//--------------------------------------------------------------------------
//Momentum Calculations
f_momTF( _tf ) =>
    _isShow =  f_tfResInMinutes(_tf) >= f_resInMinutes()
    close_ = f_source(_tf , close)
    rsi_ = _isShow ? f_security(syminfo.tickerid , _tf, ta.rsi( close_, mLength) , repaint_sw) : na
    ma = _isShow ? f_security(syminfo.tickerid , _tf, ta.vwma( hlc3 , ma_length ) , repaint_sw) : na
    [rsi_ , ma]

[ rsi , ma ] = f_momTF(TF1)

ma_color = close > ma ? ma_bullColor : ma_bearColor
plot( ma_status ? ma : na , color = ma_color , linewidth = 2 , style = plot.style_line)
//---------------------------------------------------------------------------
//Supertrend Settings // INPUTS
groupST   = "Supertrend Settings  ----------------------------------"

TF2type = input.string( Type1, 'TF' ,  options=[Type1,Type2] , inline ='tf2' , group=groupST)
setHTF2a = input.int( 4 , '' , inline ='tf2', group=groupST)
setHTF2b = input.timeframe( 'D' , '' , inline ='tf2', group=groupST)
// Get HTF from user-defined mode.
var TF2 = TF2type == Type1 ? f_multipleOfRes(ResInMinutes, setHTF2a) : setHTF2b

stLength =  input.int( 10  ,  "Supertrend Length"  ,inline='lines', group=groupST)
stmult =  input.int( 2  ,  "Mult"  ,inline='lines', group=groupST)
stHighlights        = input.bool( true ,  "Highlights",inline='lines1a', group=groupST)

f_st( _tf) =>
    _isShow =  f_tfResInMinutes(_tf) >= f_resInMinutes()
    close_ = f_source(_tf , close)
    atr= f_security(syminfo.tickerid , _tf, ta.atr(stLength) , repaint_sw)
    Up=close_ -(stmult*atr)
    Dn=close_ +(stmult*atr)
    TrendUp = 0.0
    TrendUp := close_[1]>TrendUp[1] ? math.max(Up,TrendUp[1]) : Up
    TrendDown = 0.0
    TrendDown := close_[1]<TrendDown[1]? math.min(Dn,TrendDown[1]) : Dn
    Trend = 0.0
    Trend := close_ > TrendDown[1] ? 1: close_< TrendUp[1]? -1: nz(Trend[1],1)
    stLine = Trend==1? TrendUp: TrendDown
    [Trend, stLine]
[Trend, stLine] = f_st( TF2 )

stTrend = close > stLine ? 1:-1
stplot = plot( st_status? stLine : na , color=  stTrend ==1 ? st_bullColor : st_bearColor , linewidth=1 ,title ="Supertrend")

priceLineP = plot( close , color=  na , linewidth=1 , display = display.none)
fill(priceLineP , stplot , color = stHighlights ? stTrend ==1 ? color.new(st_bullColor , 85) : color.new( st_bearColor , 85 ) : na )

//---------------------------------------------------------------------------
//Momentum BarColors

mom2a = rsi > BullLevel  ? Bullish_Bars : WBullish_Bars
mom2b = rsi < BearLevel  ? Bearish_Bars : WBearish_Bars
mom2_color = close > ma ? mom2a : mom2b

mom_color = MomBars ? mom2_color : na
barcolor(mom_color)
//-------------------------------------------------
//Momentum Strength & Values
momVal2a = rsi > BullLevel  ? 2 : 1
momVal2b = rsi < BearLevel  ? -2 : -1
momVal2 = close > ma   ? momVal2a : momVal2b

momVal = momVal2

///==============================================================================================================
//Long Trend Conditions
Entry1aL = Entry1a ? momVal == 2 : true
Entry1bL = Entry1b ? momVal == 1 or momVal == 2 : true

Entry3aL = Entry3a ? close > ma : true
Entry4aL = Entry4a ? rsi > BullLevel : true
Entry4bL = Entry4b ? close > stLine : true
Entry4cL = Entry4c ? stLine > stLine[1] : true
//------
noEntry = Entry1a == false and Entry1b  == false and Entry3a == false and Entry4a == false and Entry4b == false and Entry4c == false ? false : true
noExit  = Exit1a == false and Exit1b == false and Exit3a == false  and Exit4b == false  ? false : true
//------
EntryL =  noEntry and Entry1aL and Entry1bL and Entry3aL and Entry4aL and Entry4bL and Entry4cL

Exit1aL = Exit1a ? momVal == 1 and momVal[1] == 2 : true
Exit1bL = Exit1b ? momVal == -1  or momVal == -2 : true
Exit3aL = Exit3a ? close < ma : true
Exit4bL = Exit4b ? close < stLine  : true

ExitL = noExit and Exit1aL  and Exit3aL and Exit1bL and Exit4bL

//Short Trend Conditions
Entry1aS = Entry1a ? momVal == -2 : true
Entry1bS = Entry1b ? momVal == -1 or momVal == -2 : true

Entry3aS = Entry3a ? close < ma  : true
Entry4aS = Entry4a ? rsi < BearLevel  : true
Entry4bS = Entry4b ? close < stLine  : true
Entry4cS = Entry4c ? stLine < stLine[1] : true

EntryS =  noEntry and Entry1aS and Entry1bS and Entry3aS  and Entry4aS and Entry4bS and Entry4cS

Exit1aS = Exit1a ? momVal == -1 and momVal[1] == -2 : true
Exit1bS = Exit1b ? momVal == 1 or momVal == 2 : true
Exit3aS = Exit3a ? close > ma : true
Exit4bS = Exit4b ? close > stLine : true

ExitS  = noExit and Exit1aS and Exit3aS and Exit1bS and Exit4bS

///==============================================================================================================
//Entry & exit conditions

isLong = false
isLong := nz(isLong[1], false)
isShort = false
isShort := nz(isShort[1], false)

goLong = not isLong and EntryL and not ExitL and longOK and barstate.isconfirmed
goShort = not isShort and EntryS and not ExitS and shortOK and barstate.isconfirmed
longExit = isLong and ExitL and barstate.isconfirmed
shortExit = isShort and ExitS and barstate.isconfirmed

if (goLong)
    isLong := true
    isShort := false

if (goShort)
    isLong := false
    isShort := true

if (longExit)
    isLong := false
if (shortExit)
    isShort := false

//------------------------------------------------------------------------------
// ——Backtester
grouptime           = 'Step 5 - 📆 Time Filter 📆-------------'
startTime      = input    (group=grouptime, title="Start Timeㅤㅤ", defval=timestamp('UTC 01 Jan 2020 00:00'),  inline="Start")
endTime        = input    (group=grouptime, title="End Time ㅤ ㅤ", defval=timestamp('UTC 31 Dec 2025 23:45'),  inline="End")

dateRange = true
//------------------------------------------------------------------------------
// Risk Managment
grouprisk               = 'Step 6 - Risk Management-------------'

takeprofit = input.bool(true,title = "TP Price %",group=grouprisk, inline="profit")
tppercent = input.float(1, '', group=grouprisk, inline="profit") / 100
q1 = input.int    (5 ,              "Quantity %",group=grouprisk , inline="profit")

stoploss = input.bool(false,title = "SL Price %",group=grouprisk, inline="loss")
stoppercent = input.float(5, '', group=grouprisk, inline="loss") / 100

// Determine where you've entered and in what direction
longtp = strategy.position_avg_price * (1 + tppercent)
longStop = strategy.position_avg_price * (1 - stoppercent)
shorttp = strategy.position_avg_price * (1 - tppercent)
shortStop = strategy.position_avg_price * (1 + stoppercent)

QTYMethod               = input.string ('EQUITY',        'Order Size',    group=grouprisk, inline=' ', options=['NONE', 'EQUITY', 'SIZE', 'CONTRACTS'])
useNetProfit            = input.bool   (true,            'Use Net Profit',     group=grouprisk, inline=' ', tooltip='Use Net Profit- On/Off the use of profit in the following trades. *Only works if the type is EQUITY')
riskPerc                = input.int    (30,              '🇪🇶🇺🇮🇹🇾 %',              group=grouprisk, inline='.', minval=1, maxval=100)
riskSize                = input.int    (10000,            '🇸🇮🇿🇪',                group=grouprisk, inline='.', minval=1)
riskCntr                = input.int    (1,               '🇨🇴🇳🇹🇷🇦🇨🇹🇸',           group=grouprisk, inline='.', minval=1, tooltip='Order Size: \nNone- Use the default position size settings in Tab "Properties". \nEquity% - per trade from the initial capital. \nSize- Fixed size amount of trade. \nContracts- The fixed amount of the deal in contracts. \n')

// —————— Order Size
eqty = switch QTYMethod
    'NONE'      => na
    'EQUITY'    => riskPerc / close
    'SIZE'      => riskSize / close
    'CONTRACTS' => riskCntr
//-----------------------------------------------------------------------------
// —————— Trade variables
entry        = strategy.position_avg_price
sizePos      = strategy.position_size
inLong       = sizePos > 0
inShort      = sizePos < 0
inTrade      = inLong or inShort
inPos        = (inLong and not inShort[1]) or (inShort and not inLong[1])
var ID       = 'TradeID'
var tpPrice  = float(na)
var slPrice  = float(na)

///==============================================================================================================
// ALERTS
groupalerts = 'Step 7 - Alerts & Bot Trading Settings-------------'

broker = input.string('Binance', "Broker", options=['Binance', 'Alpaca', 'Kucoin', '3Commas'], group=groupalerts, tooltip = 'Choose which type you are using to send the correct Json Alert message for entry and exit alerts.')
my_sym = input("FTMM/USDT", "Ticker", group = 'Cloud Function Server', tooltip = 'Only used with Alerts to fix ticker ID in json message. Some exchanges use the forward slash and some do not.')
my_pass = input('Passphrase', "Passphrase" , group = 'Cloud Function Server', tooltip = 'Only enter your Passphrase and nothing else goes here. Only needed when using a Cloud Function Server.')
i_alert_3CID_txt = input('Bot ID', "Bot ID", group =groupalerts, tooltip = 'Only enter your 3Commas Bot ID and nothing else goes here.')
i_alert_3CET_txt = input('Bot Email Token', title = 'Bot Email Token', group =groupalerts , tooltip = 'Only enter your 3Commas Bot Email Token and nothing else goes here.')

Alert='{"passphrase": "'+str.tostring(my_pass)+'","symbol": "'+ str.tostring(my_sym) +'","type":"market", "side":"{{strategy.order.action}}","amount":"{{strategy.order.contracts}}","price": "' + str.tostring(close) + '"}'
//---------------------------------------------------------------------------------
// JSON alert message used for 3Commas Bots
C3_EntryAlert ='{"message_type": "bot",  "bot_id": ' + i_alert_3CID_txt + ',  "email_token": "' + i_alert_3CET_txt + '", "delay_seconds": 0 }'
C3_ExitAlert ='{"action": "close_at_market_price_all",  "message_type": "bot",  "bot_id": ' + i_alert_3CID_txt + ',  "email_token": "' + i_alert_3CET_txt + '", "delay_seconds": 0}'
//---------------------------------------------------------------------------------
// JSON alert message used for setting up a Google Cloud Function Server works when using Alpaca Exchange
Alert_Alpaca = '{"symbol": "{{ticker}}", "quantity": "{{strategy.order.contracts}}", "side": "{{strategy.order.action}}", "order_type": "market", "time_in_force": "gtc", "passphrase": "' + str.tostring(my_pass) + '"}'

entryAlert = broker == 'Binance' ? Alert : broker == 'Alpaca' ? Alert_Alpaca : broker == 'Kucoin' ? Alert : C3_EntryAlert
exitAlert = broker == 'Binance' ? Alert : broker == 'Alpaca' ? Alert_Alpaca : broker == 'Kucoin' ? Alert : C3_ExitAlert
strategy.initial_capital = 50000
// —————— Entry's
goLongEntry = goLong and dateRange and barstate.isconfirmed
goShortEntry = goShort and dateRange and barstate.isconfirmed

eqty(qty) => QTYMethod=='EQUITY' ? qty / 100 * (strategy.initial_capital + (useNetProfit ? strategy.netprofit : 0)) : QTYMethod=='SIZE' ? qty / syminfo.pointvalue : qty
if goLongEntry
    ID := 'Long'
    strategy.entry(ID, strategy.long,  qty=eqty(eqty), comment=ID, alert_message = entryAlert)

if goShortEntry
    ID := 'Short'
    strategy.entry(ID, strategy.short, qty=eqty(eqty), comment=ID, alert_message = entryAlert)

// —————— Exit's
qty(perc) => math.abs(sizePos*perc/100)

if longExit
    strategy.close("Long",comment='X', alert_message= exitAlert)
strategy.exit ("exit1", from_entry="Long", limit=takeprofit ? longtp : na, stop=stoploss ? longStop : na, comment_profit='TP', comment_loss='SL', qty_percent=q1)
strategy.exit ("exit2", from_entry="Long", stop=stoploss ? longStop : na, comment_loss='SL')

if shortExit
    strategy.close("Short",comment='X', alert_message= exitAlert)
strategy.exit ("exit1", from_entry="Short", limit=takeprofit ? shorttp : na, stop=stoploss ? shortStop : na, comment_profit='TP', comment_loss='SL', qty_percent=q1)
strategy.exit ("exit2", from_entry="Short", stop=stoploss ? shortStop : na, comment_loss='SL')

///==============================================================================================================

//Style- Plots on Chart
posH = high + 2 * stLine
posL = low - 2 * stLine

plotshape( goLong and PlotEntries ? posL : na ,'Long Entry Signals' , text= '' , location=location.belowbar, style=shape.labelup , size=size.small ,  color=lbullColor , textcolor = color.white )
plotshape( longExit and PlotExits ? posH : na  ,'Long Exit' , location=location.abovebar, style= shape.xcross  , size=size.small,  color=lbullColor )
plotshape( goShort and PlotEntries ? posH : na ,'Short Entry Signals'  , text= '' , location=location.abovebar, style=shape.labeldown , size=size.small  , color=lbearColor  , textcolor = color.white )
plotshape( shortExit and PlotExits ? posL : na  ,'Short Exit' , location=location.belowbar, style=shape.xcross   , size=size.small ,   color=lbearColor )

///==============================================================================================================
// Alerts
alertcondition( goLong  , 'Long Entry Alerts', 'Long Alerts')
alertcondition( goShort , 'Short Entry Alerts', 'Short Alerts')