Doppelte Supertrend-Nachhaltigkeits-Stop-Loss-Strategie

Überblick
Die Strategie basiert auf einem superstarken Index-Gleichbewegungsmittel und einem relativ starken Index und hat einen doppelten Trend-Tracking-Mechanismus entwickelt, der die Trendentwicklung präzise beurteilt und einen angemessenen Stop-Loss-Stopppunkt festlegt. Die Strategie hat die Eigenschaften, dass der Stop-Loss-Stopppunkt dem Trend folgt und der Stop-Loss-Stopppunkt dem Trend entsprechend festgelegt wird.
Strategieprinzip
-
Berechnen Sie einen Supertrend, um die Richtung des Haupttrends zu bestimmen. Der Supertrend kann die Richtung des Trends genau bestimmen und einen idealen Einstiegspunkt liefern.
-
Der RSI wird als Trendindikator verwendet. Ein hoher RSI ist ein Überkaufbereich, der den Trend in der Bullenmärkte darstellt. Ein niedriger RSI ist ein Überverkaufbereich, der den Trend in der Bärenmärkte darstellt.
-
Wenn der Schlusskurs den Super Strong Index Flat Moving Average überschreitet, machen Sie einen Plus; wenn der Schlusskurs den Super Strong Index Flat Moving Average überschreitet, machen Sie einen Minus.
-
Setzen Sie einen vernünftigen Stop-Loss-Stopppunkt. Wenn Sie zu viel tun, verwenden Sie den Superstar Index Smoothed Moving Average als Stop-Line, um den Superstar Index Smoothed Moving Average mit einem vernünftigen Gewinn-Stopppunkt zu verwenden. Wenn Sie kurz machen, verwenden Sie den Superstar Index Smoothed Moving Average als Stop-Line, um den Superstar Index Smoothed Moving Average abzüglich des vernünftigen Gewinns als Stopppunkt.
-
Die Stop-Loss-Linie bewegt sich in die günstige Richtung, wenn sich der Kurs in die günstige Richtung bewegt, um den Gewinn zu sichern.
-
Wenn der RSI mit der Richtung des Super Strong Index Smooth Moving Averages übereinstimmt, ist der Trend stark, und die Strategie wird eingesetzt. Wenn der RSI nicht mit der Richtung des Super Strong Index Smooth Moving Averages übereinstimmt, ist die Möglichkeit einer Trendwende, und die Strategie wird vorübergehend ausgeschaltet.
Analyse der Stärken
-
Dual-Trend-Beschlussmechanismen können Fehlsignale reduzieren und die Strategie-Stabilität erhöhen.
-
Der Stop-Loss-Punkt bewegt sich mit dem Trend, um die Gewinne zu maximieren und zu verhindern, dass Verluste zu früh gestoppt werden.
-
Die Verwendung des RSI-Indikators filtert einige schwache Handelssignale aus.
-
Das ist eine sehr gute Idee, um den Gewinn zu maximieren.
-
Die Strategieparameter sind anpassbar und können je nach Sorte und Gegebenheiten optimiert werden.
-
Strategische Rücknahme ist kontrollierbar, mit einer starken Risikomanagement-Fähigkeit.
Risikoanalyse
-
Im Falle von Ereignissen, wie z. B. großer politischer Nachrichten, kann es zu starken Schwankungen kommen, die dazu führen, dass die Stop-Loss-Punkte überschritten werden, was zu größeren Verlusten führt. Die Stop-Loss-Punkte können angemessen gelockert werden oder vor dem Eintritt eines wichtigen Risikos rechtzeitig verlassen werden.
-
Die Parameter sind falsch eingestellt, was dazu führen kann, dass die Stop-Loss-Stopp-Punkte unvernünftig eingestellt werden, die Verluste vergrößern oder die Gewinne verkleinern. Die optimale Kombination von Parametern kann durch wiederholte Rückmessung gefunden werden.
-
In der Phase der Multi-Sphäre-Kampf, RSI und Super-Strength-Index Gleitende Moving Averages kann eine gewisse Abweichung auftreten, was zu einer falschen Handelssignalstrategie führt. In dieser Zeit kann vorübergehend nicht gehandelt werden, bis ein klarer Trend eingeschaltet ist.
Optimierungsrichtung
-
Optimierung der ATR-Zyklusparameter, um sie besser an die Eigenschaften der verschiedenen Sorten anzupassen.
-
Optimieren Sie die RSI-Parameter-Einstellungen, um stabilere und zuverlässigere Hilfsbedingungen für die Trendbeurteilung zu finden.
-
In Kombination mit anderen Indikatoren wie Brinband, KDJ usw. wird eine genauere Einstiegs- und Ausstiegsbasis festgelegt.
-
Verschiedene Stopp-Strategien, wie Tracking-Stopps, Treppen-Stopps, Shadow-Stopps, etc. werden getestet, um die Gewinnspanne zu optimieren.
-
Anpassung der Positionsmanagementstrategie an die Rückmeldungsergebnisse, um das Risiko für einzelne Geschäfte zu verringern.
Zusammenfassen
Die Strategie als Ganzes hat eine starke Stabilität und dauerhafte Profitabilität. Die doppelte Trendentscheidungsmechanik kann den Lärm effektiv filtern, die Stop-Loss-Strategie kann den Gewinn sperren und das Risiko kontrollieren. Durch die kontinuierliche Optimierung der Parameter-Einstellungen und der Einstiegs- und Ausstiegsbedingungen kann die Strategie in verschiedenen Marktumgebungen eine gute Leistung erzielen.
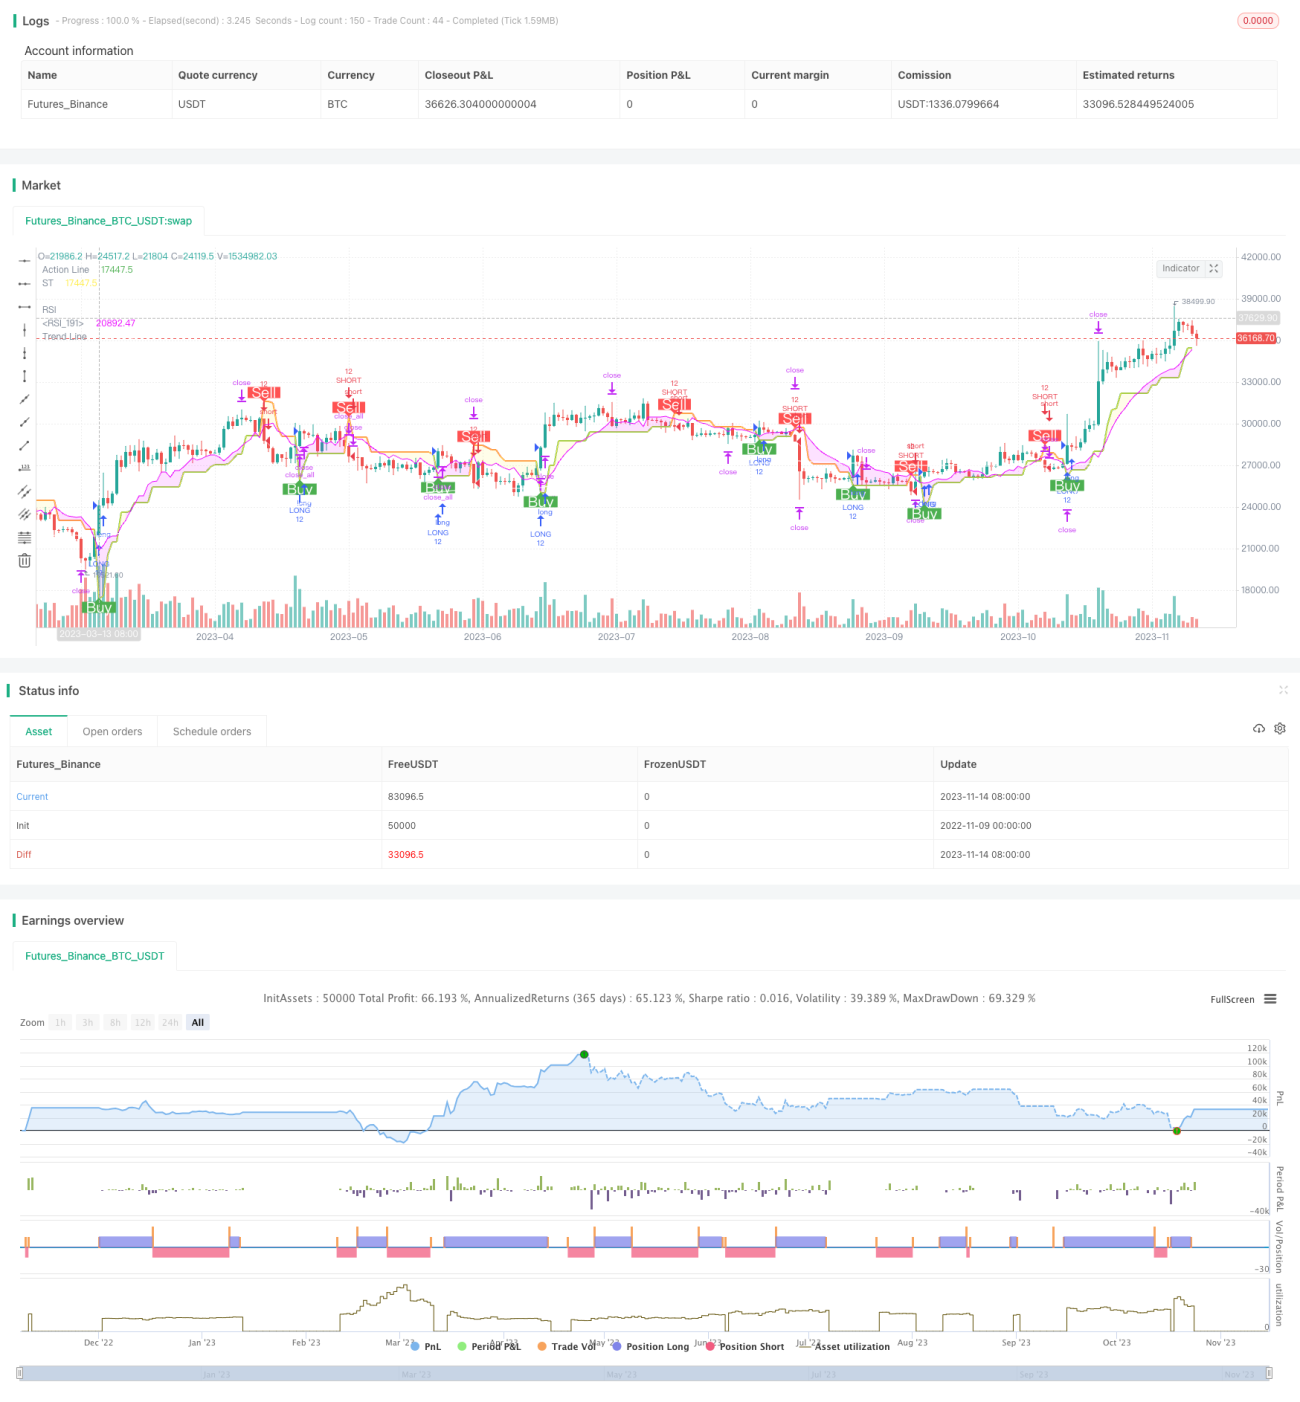
/*backtest
start: 2022-11-09 00:00:00
end: 2023-11-15 00:00:00
period: 1d
basePeriod: 1h
exchanges: [{"eid":"Futures_Binance","currency":"BTC_USDT"}]
*/

//@version=5
//
// ▒▒▒▒▒▒▒▒▒▒▒▒▒▒▒▒▒▒▒▒▒▒▒▒▒▒▒▒▒▒▒▒▒▒▒▒▒▒▒▒▒▒▒▒▒▒▒▒▒▒▒▒▒▒▒▒▒▒▒▒▒▒▒▒▒▒▒▒▒▒▒▒▒▒▒▒▒▒▒▒▒▒▒▒▒▒▒▒▒▒▒▒▒▒▒▒▒▒▒▒▒▒▒▒▒▒▒▒▒▒▒▒▒▒
// ------------------------------------------------------------------------------ 1